

Expenses Relations
SAP RealSpend
Overview
SAP RealSpend is a product in the field of managerial finance, with the goal of supporting busy Managers in committing best informed decisions based on their team(s) expenses live data.
The Relations Expenses feature was requested by one of our co-innovation partners. We looked into the problems Managers with several cost centres could face when in need to approve an unplanned expense request. Or in need to argument requesting extra budget or voicing an expense cut with stakeholders.

My contribution as Senior Experience Designer:
Observe interviews with experts and take notes;
Synthesise data from interviews;
Debate AS-IS process with stake holders;
Create collaboration map (based on qualitative data);
Design interactive high-fidelity static prototypes;
Contributions on visual design on the hi-fi prototype;
1. Strategy
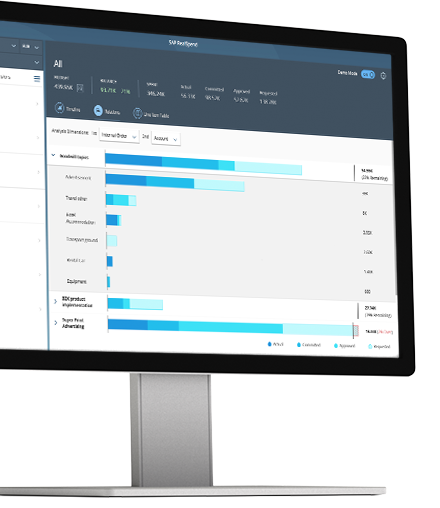
Business Objective: deliver an easy to use tool that could cause a change of behaviour, helping managers to always have glimpse on where they’re standing when relating Accounts to Cost Centers or to Internal Orders – in details or overview mode (and vice versa).
Target Audience: controllers, business analysts and managers in higher level of hierarchies, responsible for several 3 cost centers.
Differentiators: our solution aim to innovate the way users visualize their expenses based on accurate data, enhancing decision making on fast-paced environments. Making use of live-data, and pre-defined calculations, users may rely on non-conflicting figures, when reporting and making informed decisions on their strategy concerning budget planning and approving unplanned requests.
2. User Needs
Motivation: to work within a smoother and less time consuming team collaboration regarding managerial finance. To commit better informed decisions on a faster pace. Communicate reports to stakeholders with the help of live data and the ability to relate a specific Account to Cost Centers or to Internal Orders (or vice versa) and easily share this visually appealing overview in contrast to old SAP GUI or excel reports.
Pain Points: too many tasks and time limitation to onboard managers and to deal with conflicting or not up-to-date figures. Tools are not integrated, which makes user check different sources of data, needing to generate several reports monthly or quarterly. Rarely users access live or what they call real data (ERP data reflecting the real world).
USER RESEARCH
The user research was based in 1:1 interviews, 1h long per participant, with a total of 15 interviews.
The goal was to understand:
the way they currently work on managerial finance tasks;
the tools they use (or used) to complete their tasks;
how RealSpend made their life easier;
what are the pain points found in the live version of our tool;
how do they collaborate today;
how the onboarding material and media helped them to get started;
the value perceived in Expenses Relations feature.
SYNTHESIS & LEARNINGS
We discovered that Managers in higher positions within an organisation, usually are way too busy with several strategic topics, apart from people’s management, and very unlikely would control the managerial finance completely independent of a controller or business analyst. For that, we have focused on controllers and business analysts, as main players on such high responsibility task of allocating budget to several teams, re-allocating or requesting extra budget when needed, and making sure the reports are flawless in their organisation year closing.
Persona Managerial Finance Controller
OPPORTUNITIES
We learned that the Manager persona could, over time, feel more enthusiastic about having a glimpse of “where am I standing considering travel expenses and our 7 teams” or “where I am standing considering the education expenses for our 7 teams?”. As long as they could get used to an easy-to-use tool they could occasionally enjoy it.
From this insight, we embraced the fact that a change of behaviour was at stake. As possible solutions to this insight, we debated on: a more appealing onboarding material, in-app video and textual help and demo in conferences.
POINT OF VIEW
How might we empower managers (with several cost centers) to quickly monitor their teams expenses in relation to their accounts.
How might we change behaviours, turning managers active consumers of fin data (do the monitoring of expenses having a live overview) in order to approve unplanned requests and communicate these to stakeholders.
How might we empower controllers and business analysts to spend less time pulling data from different sources to build reports, to make a point when the need to request extra budget appears.
Collaboration Map
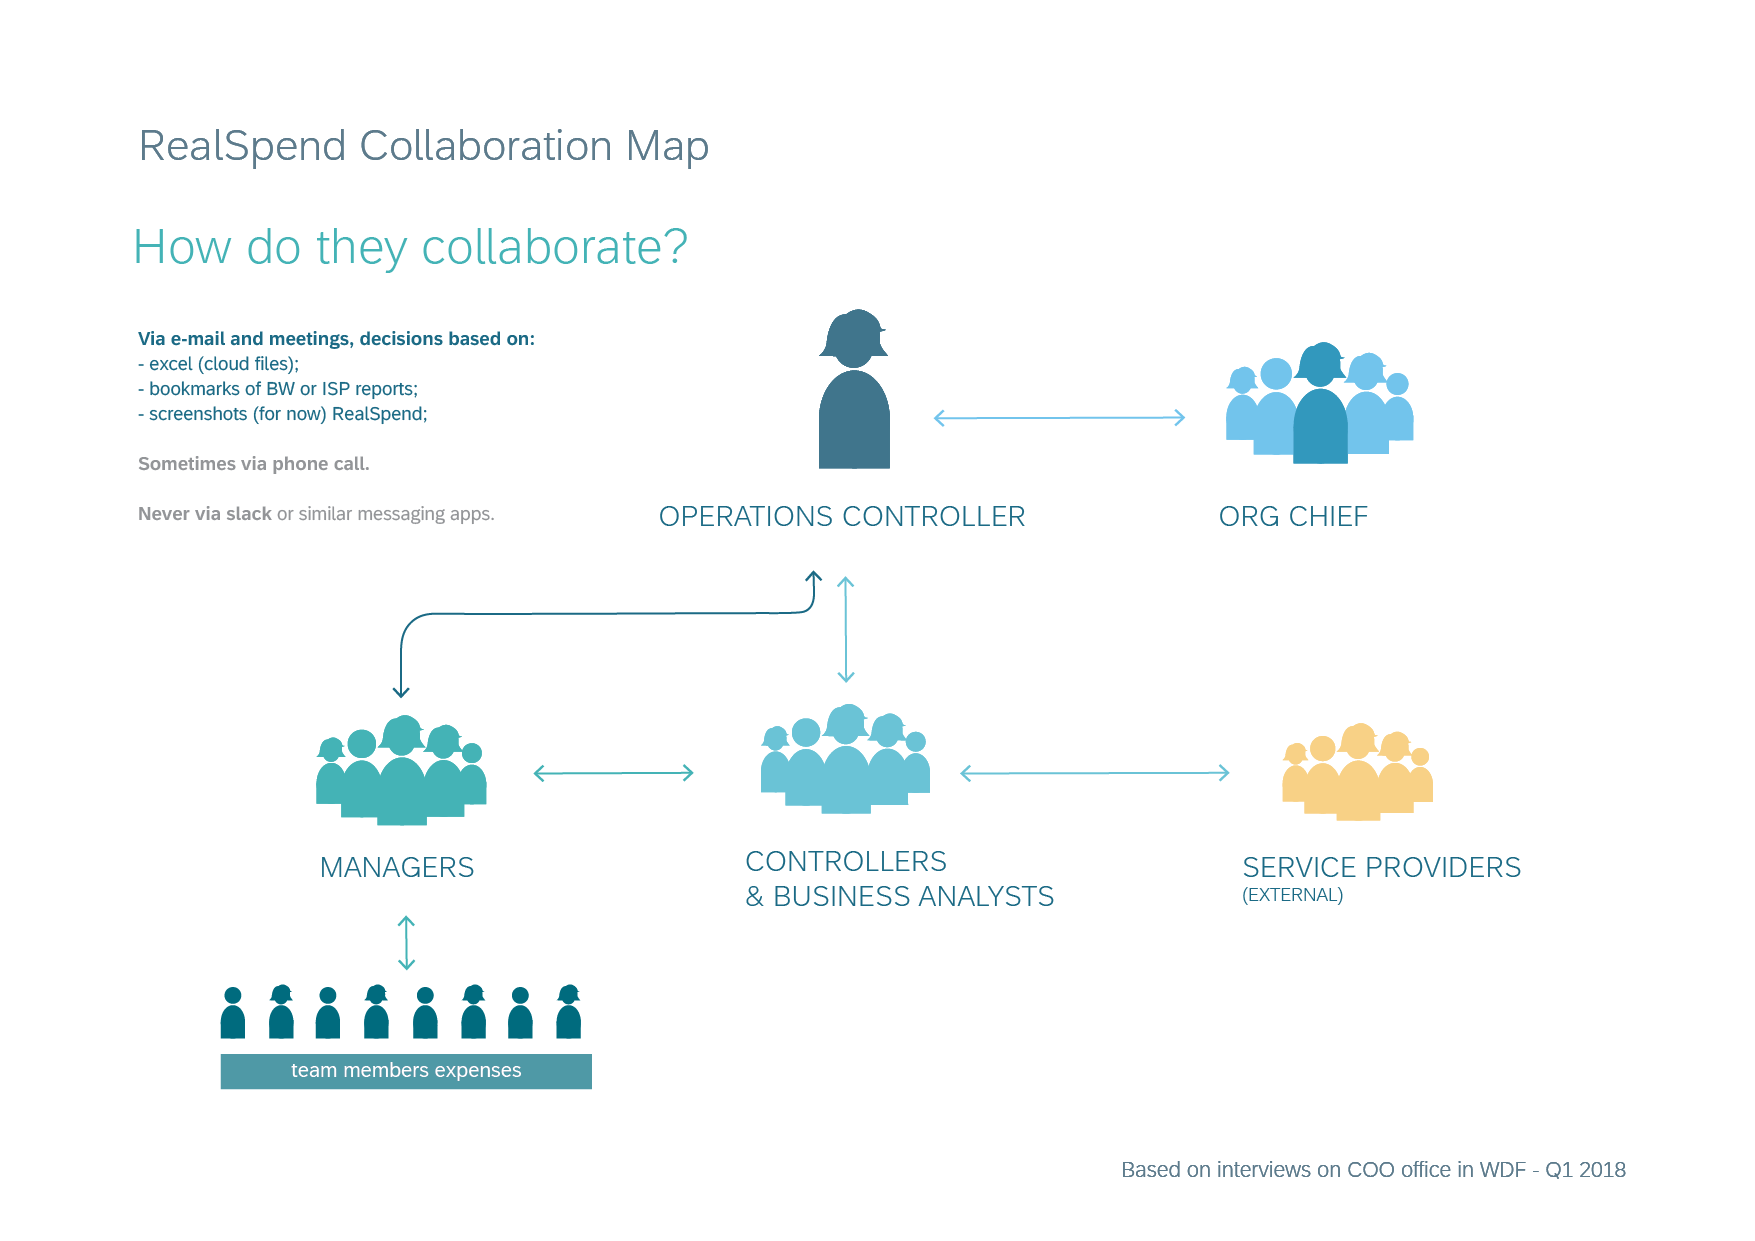
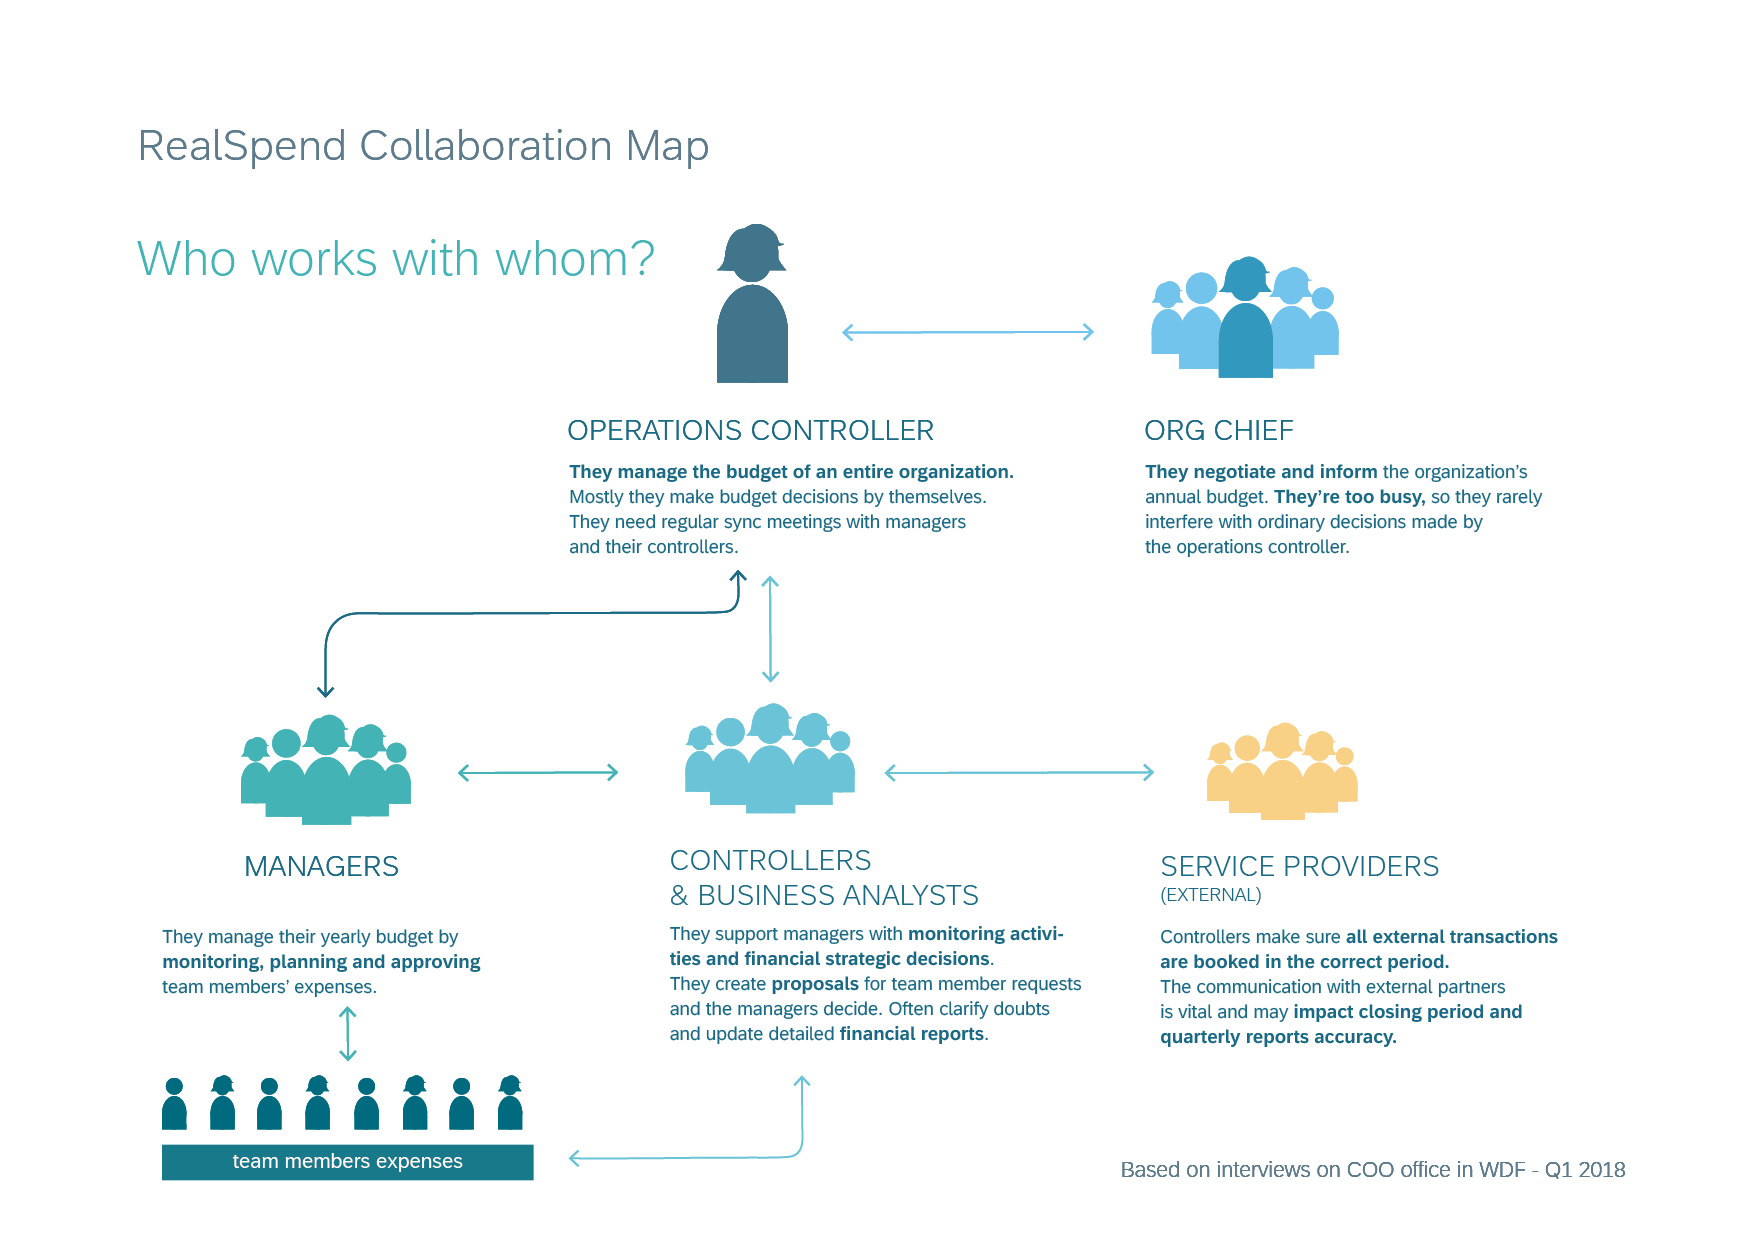
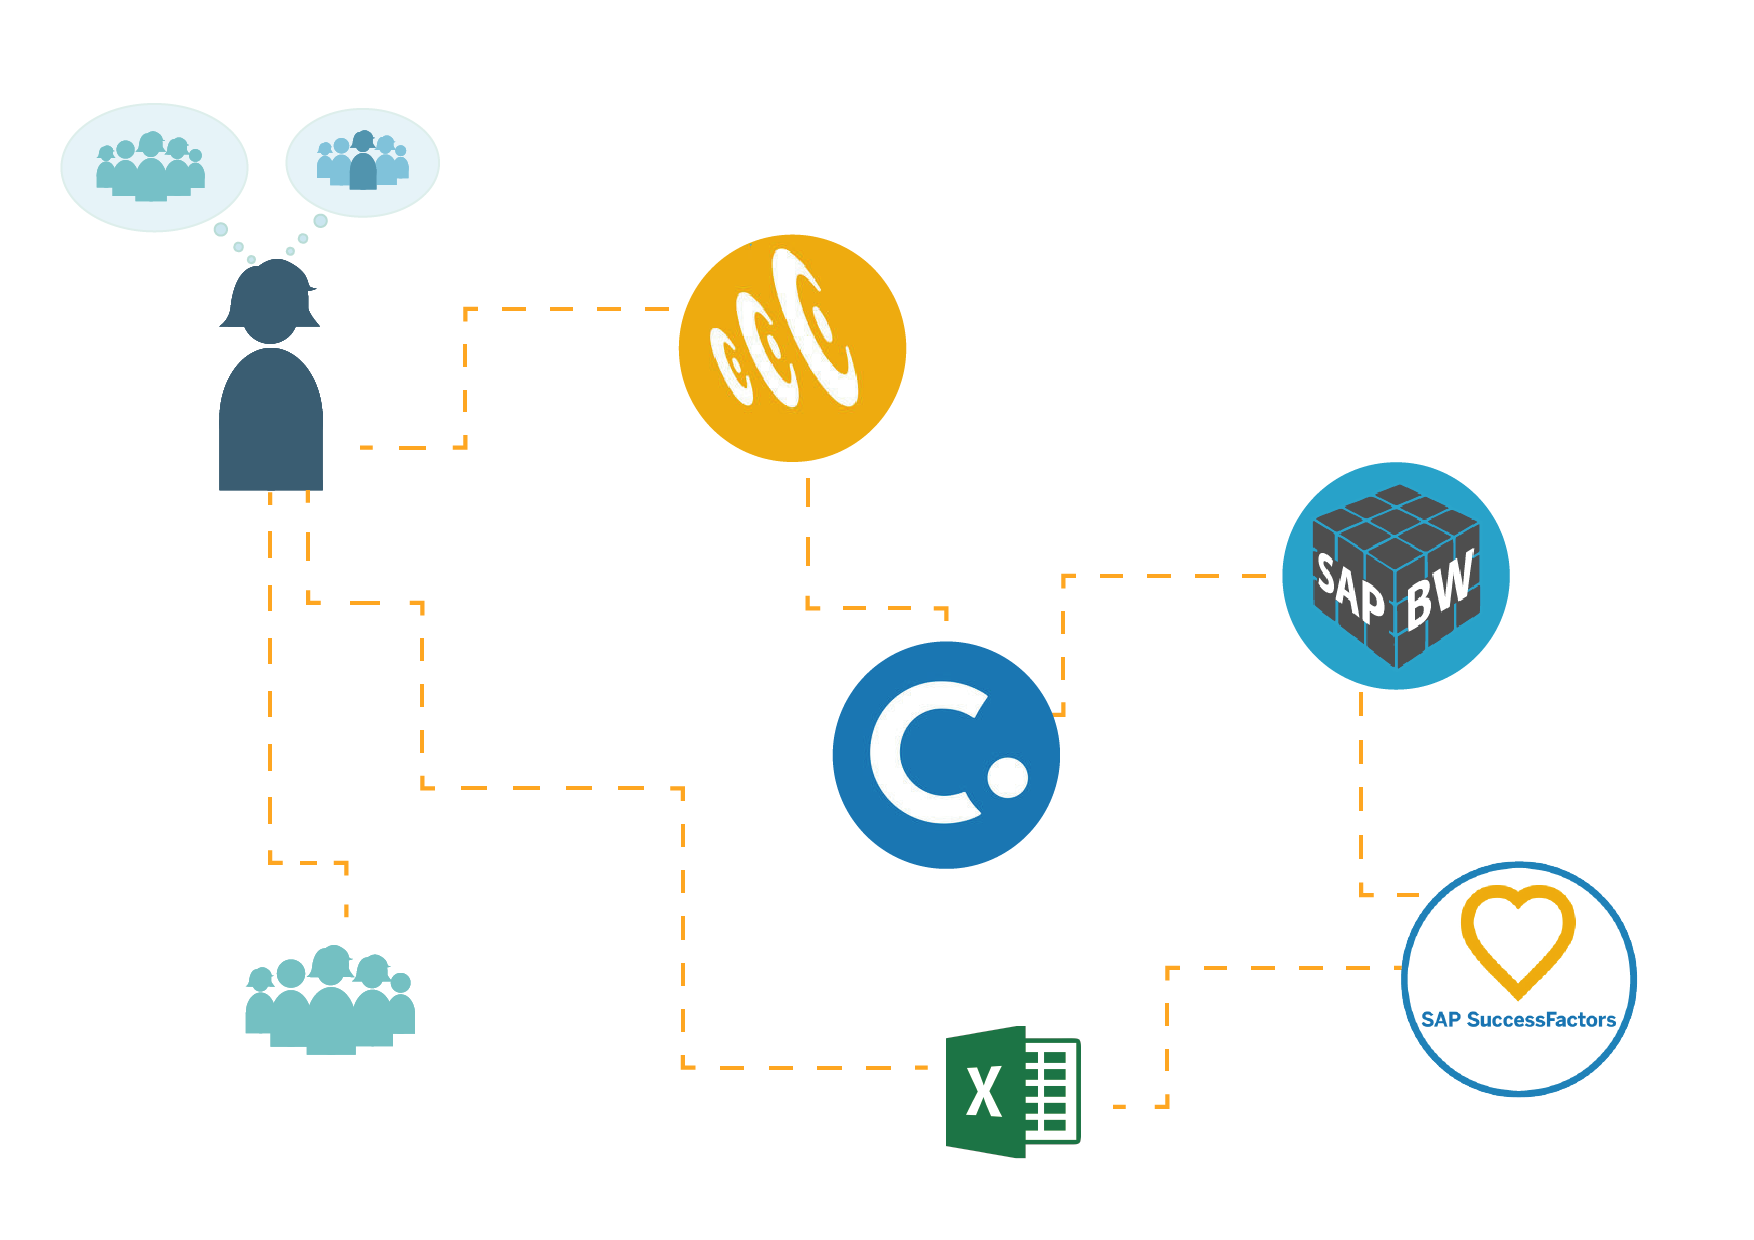
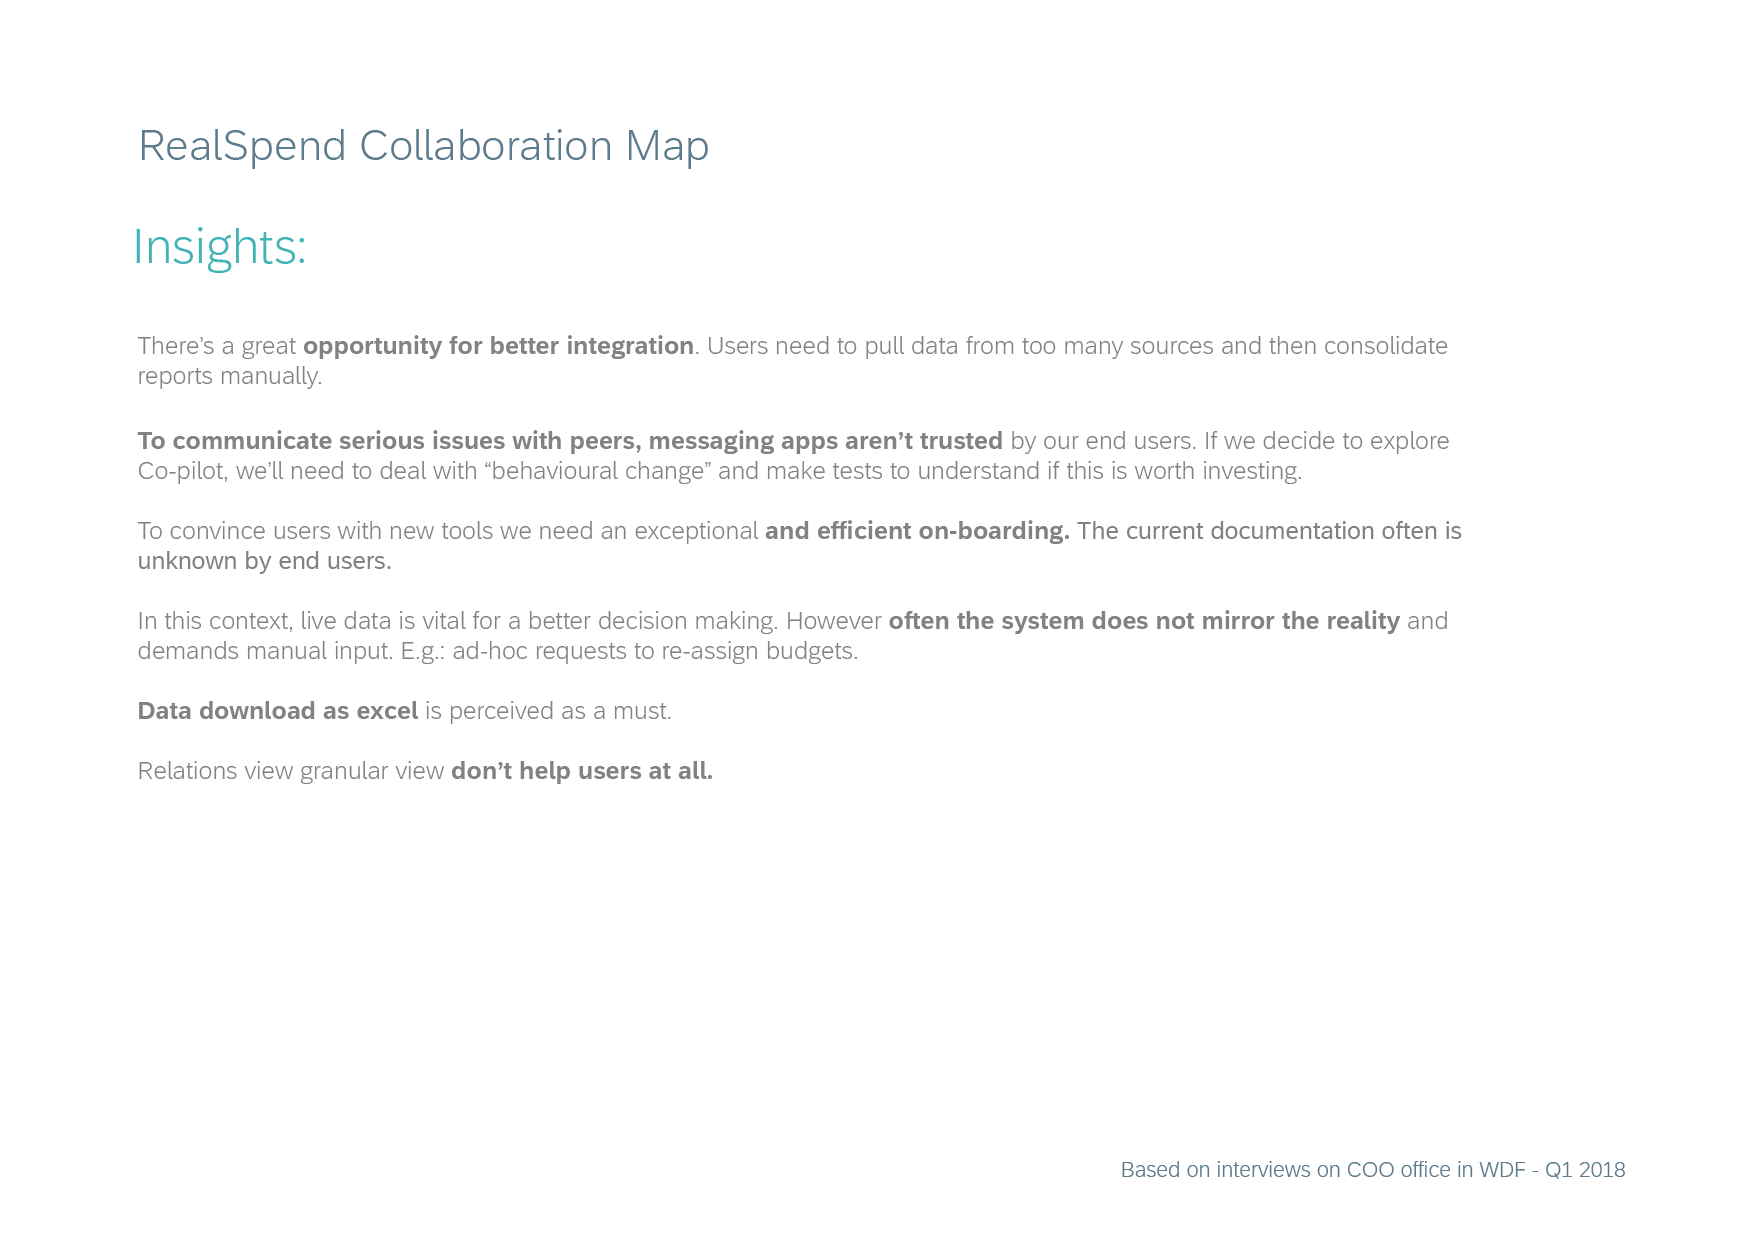
In our research we understood how would the teams and roles work regarding a few managerial finance tasks. We synthesised this qualitative data as a collaboration map. Based on it we could also understand which persona plays a bigger role in the Relations feature.
3. Experience Design
Based on research insights, and debates with product owners and tech experts the Relations feature was enhanced via:
the re-design of experience of its main interactions
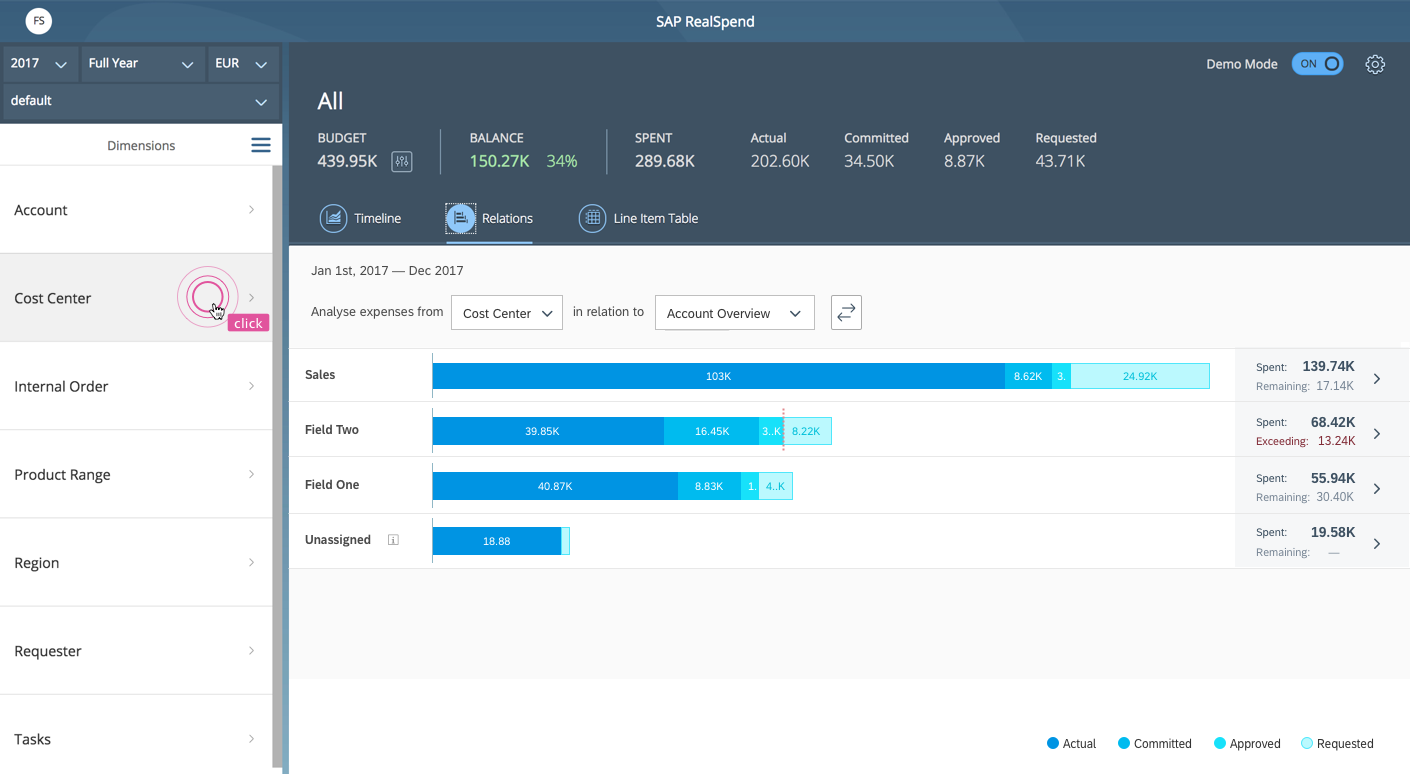
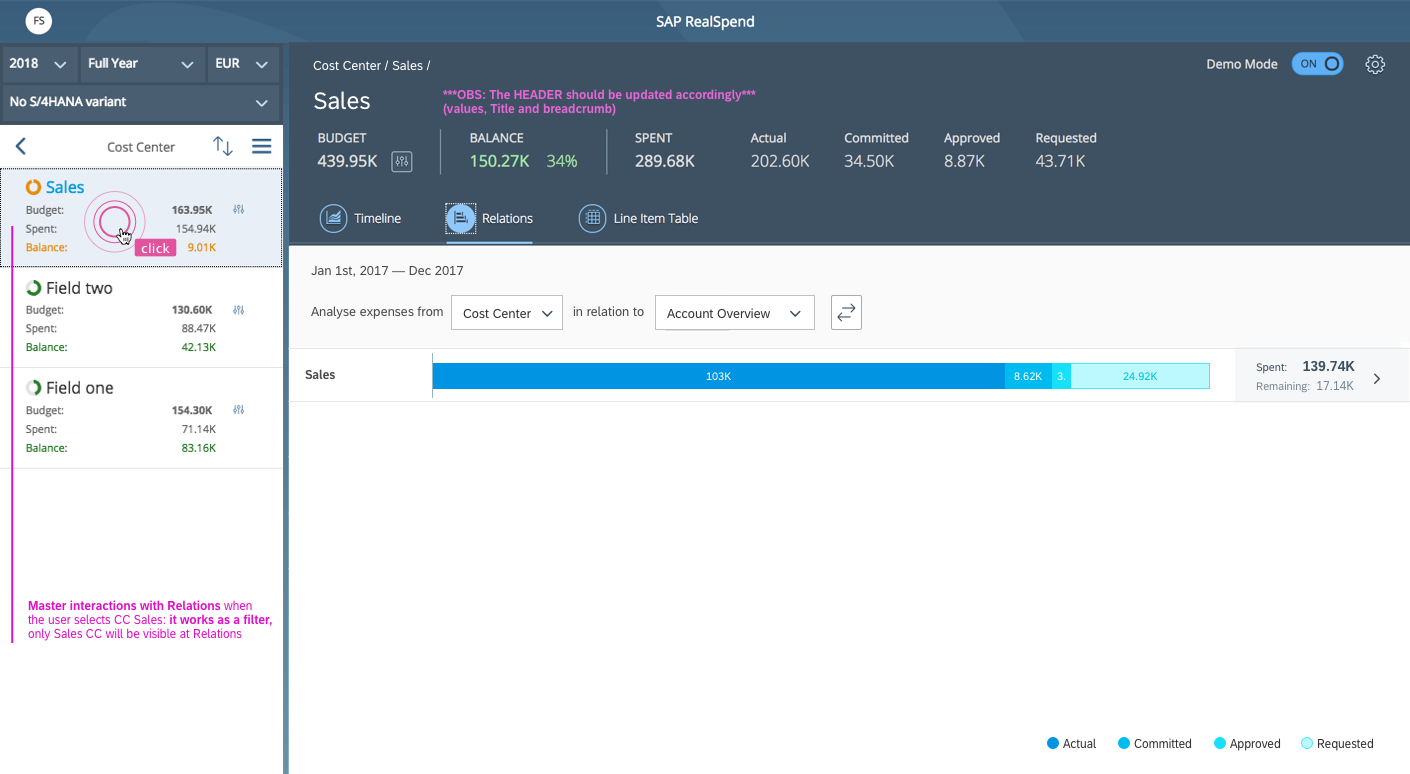
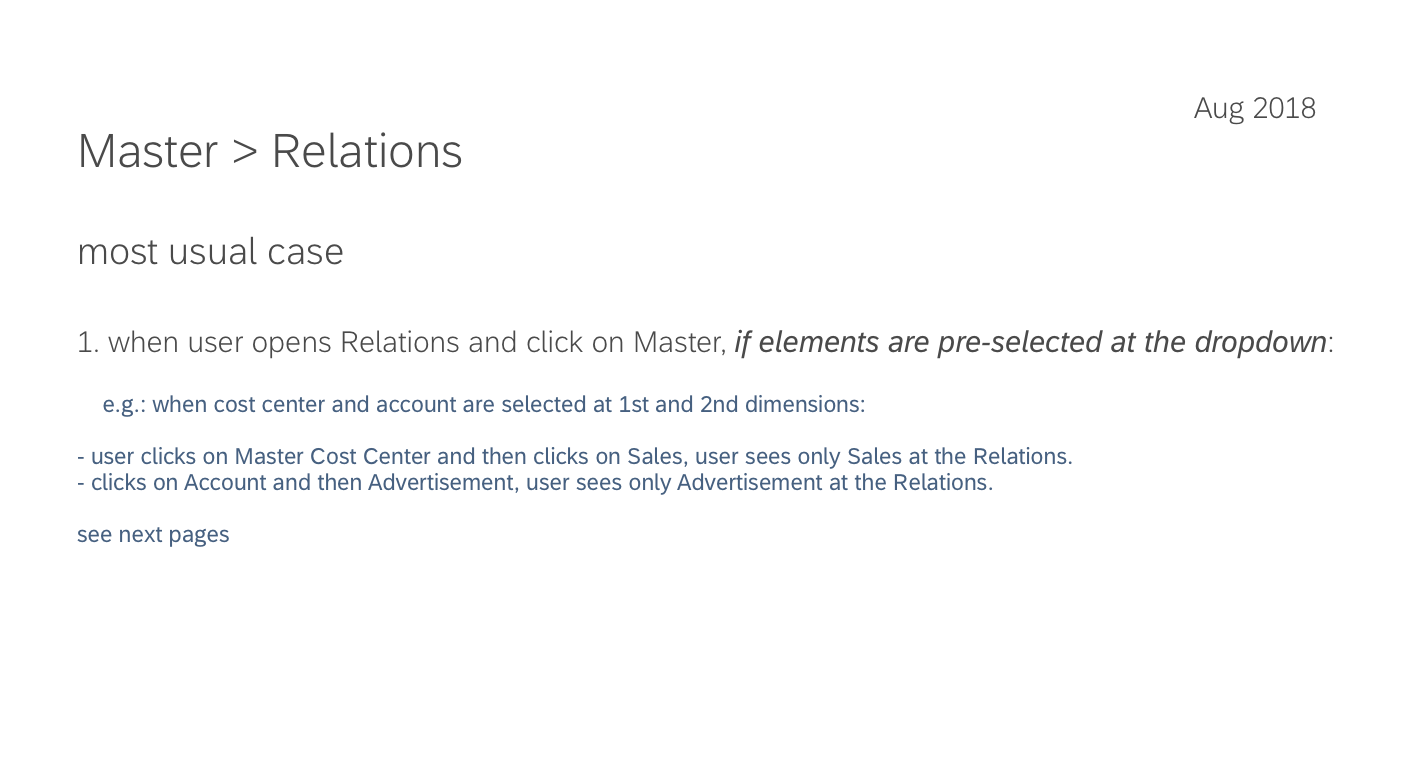
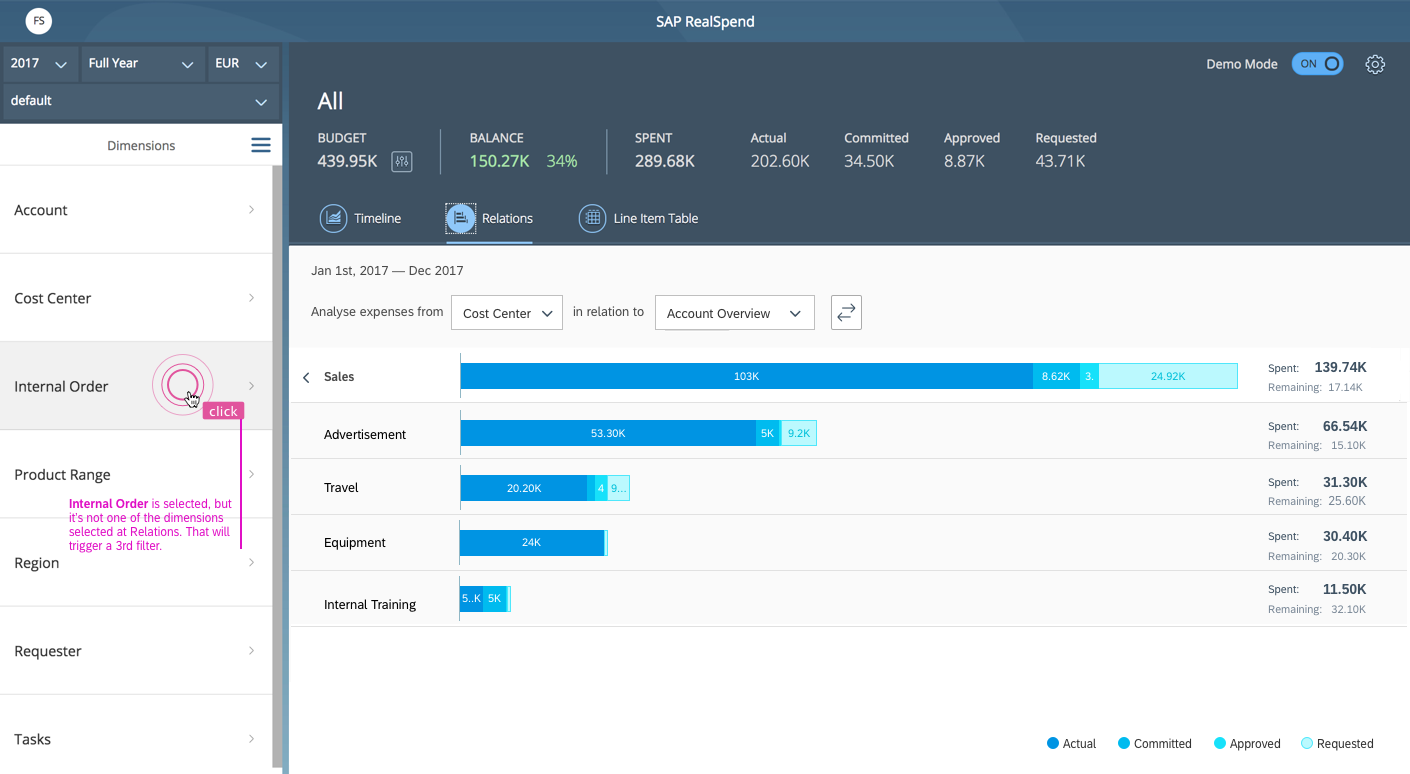
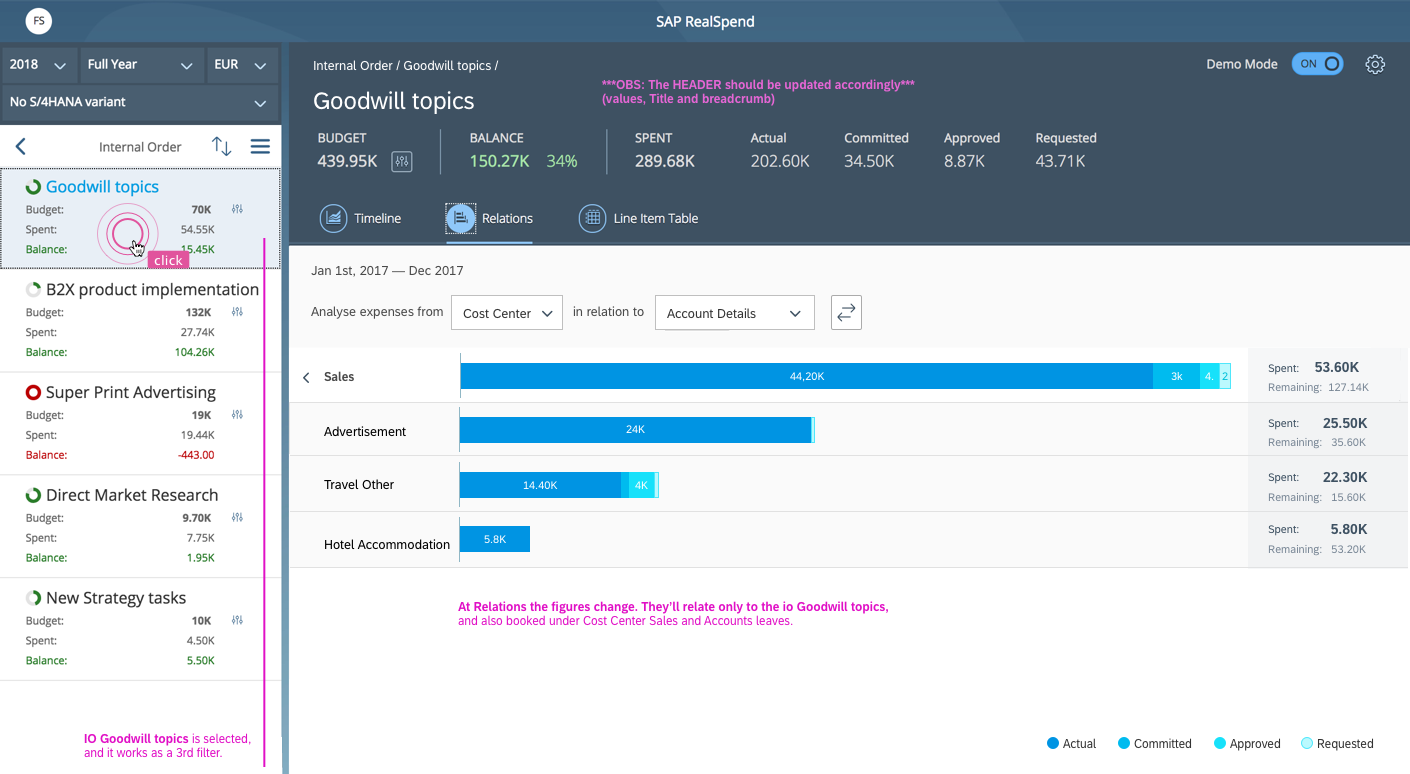
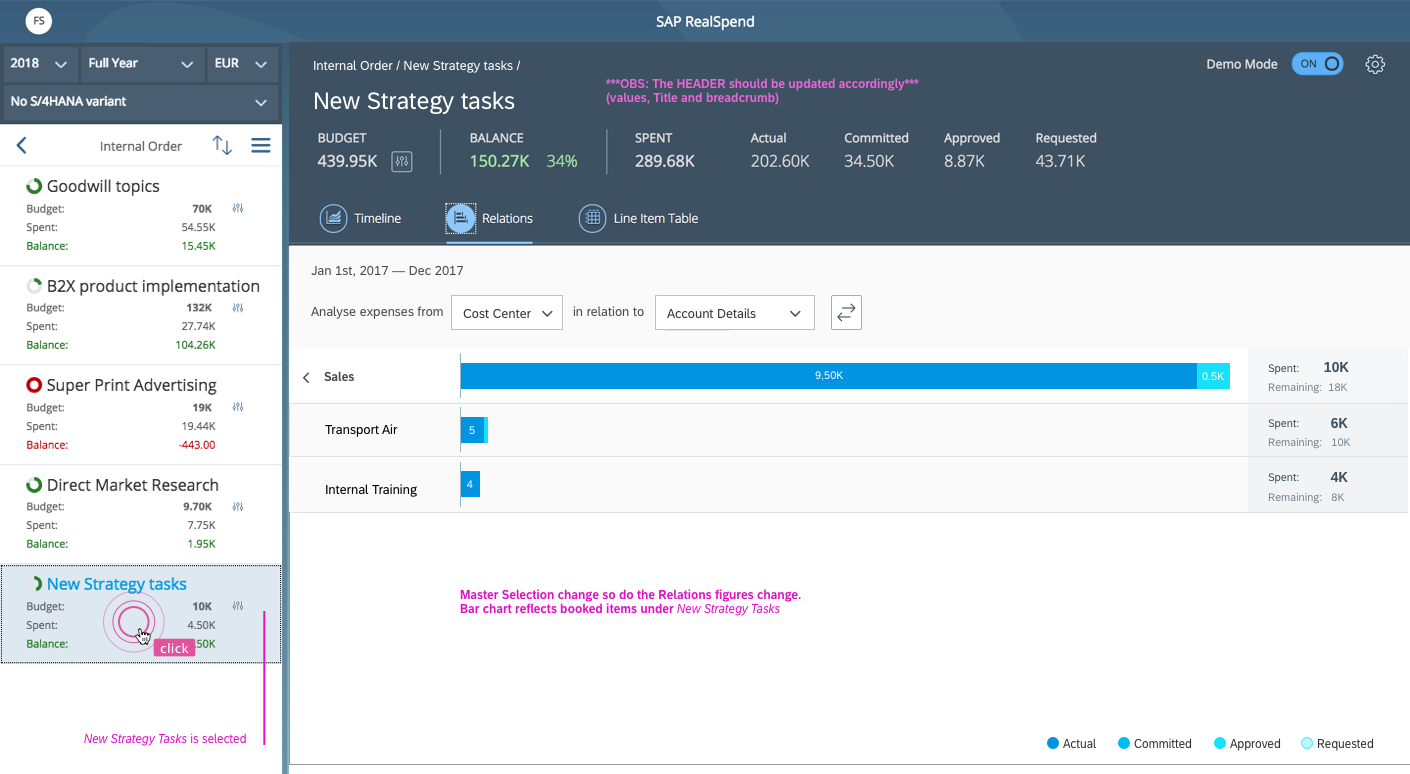
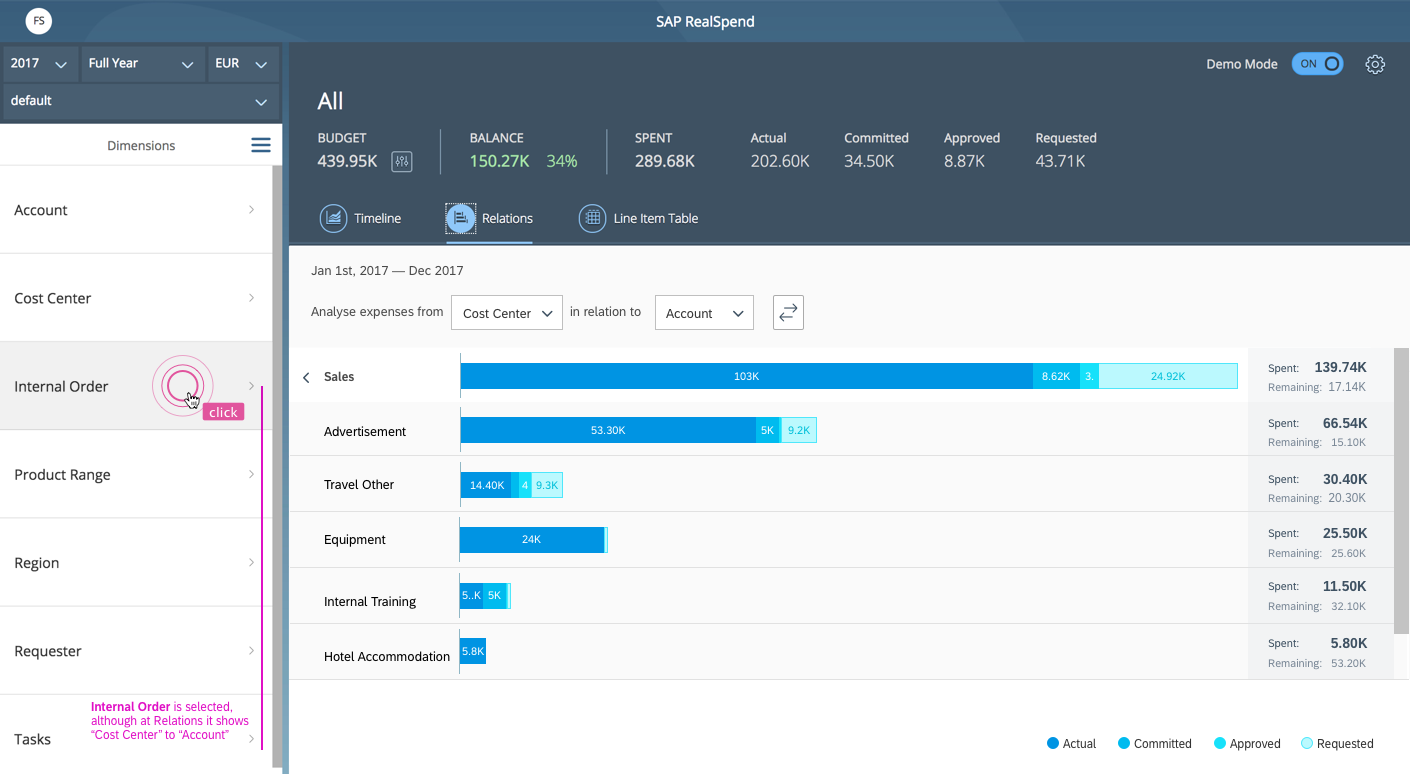
bug fix and clearer navigation with Master – Detail behaviour;
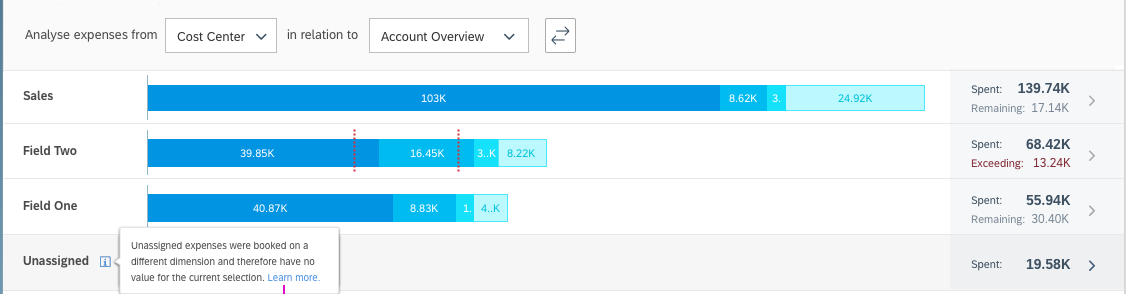
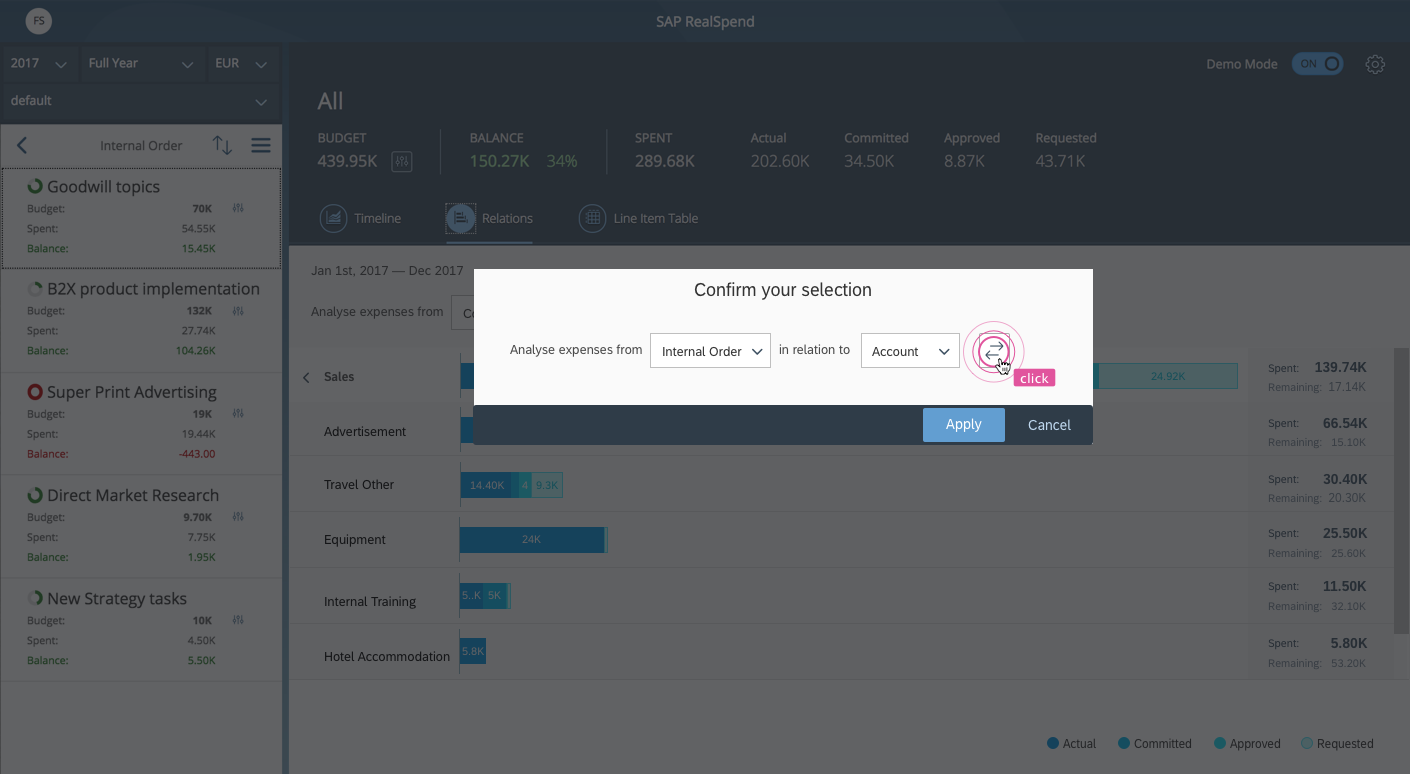
new navigation via dropdown of 1st dimension in relation to 2nd (suggesting user friendly instead of technical terms);
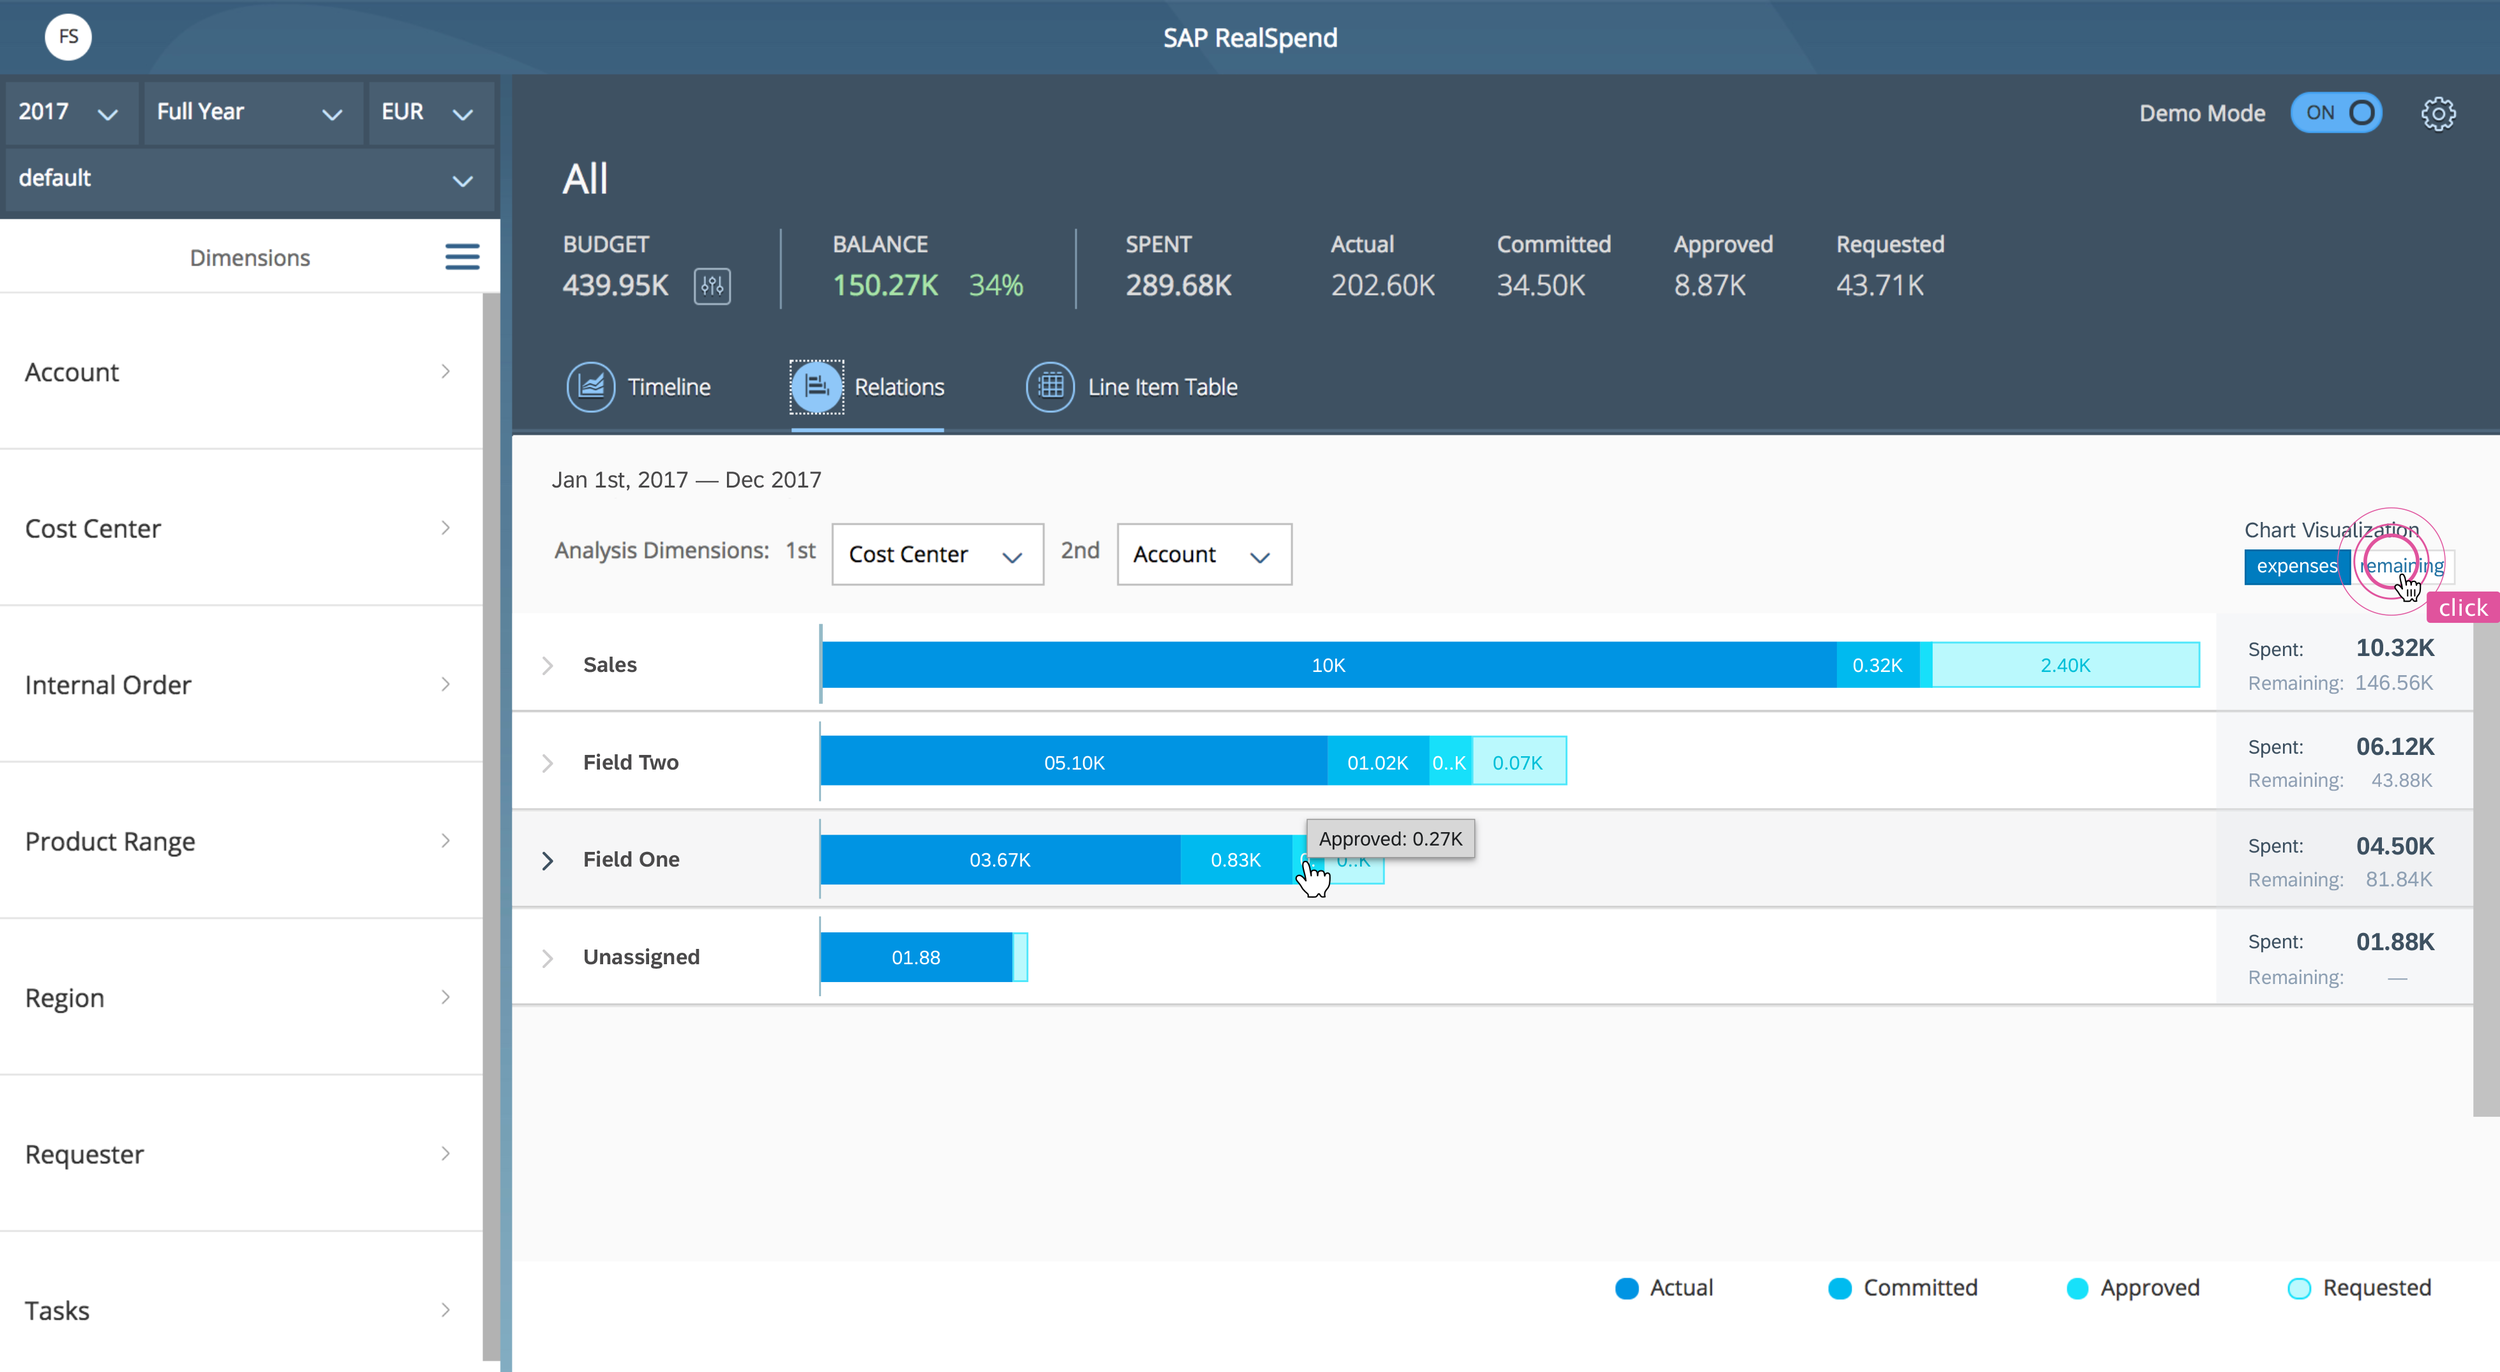
a less granular data visualisation using “Overview” and “Details” enhancing user analysis;
new navigation reducing the elements on screen for immediate line-item drill down.
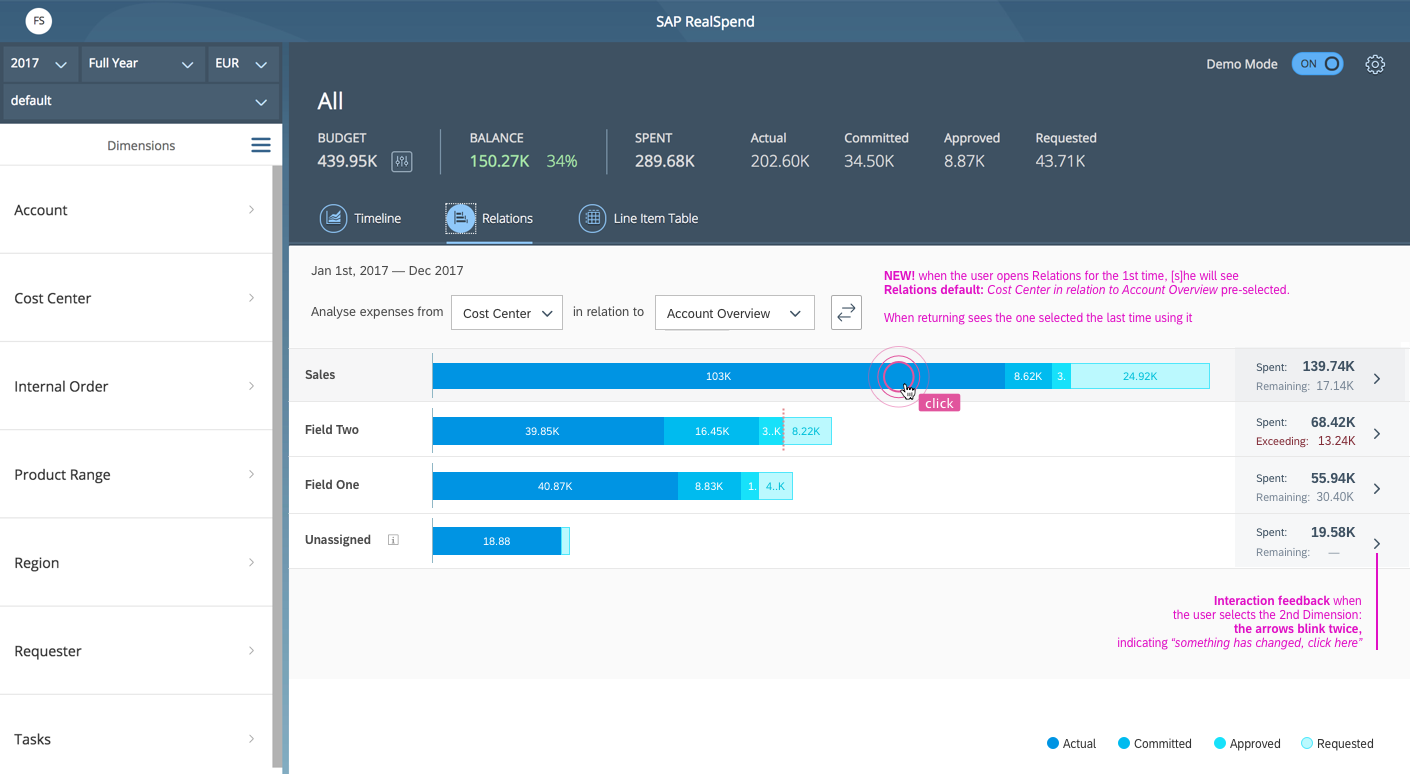
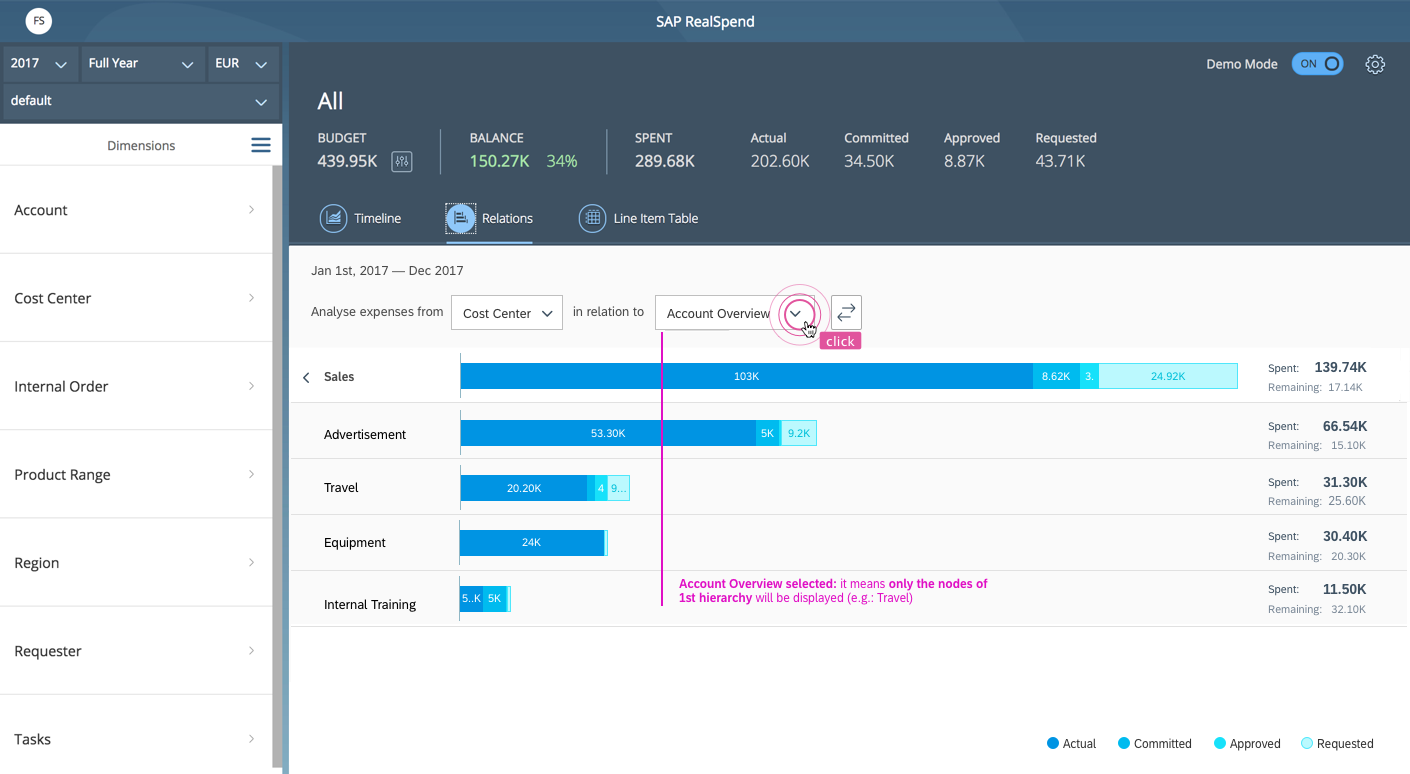
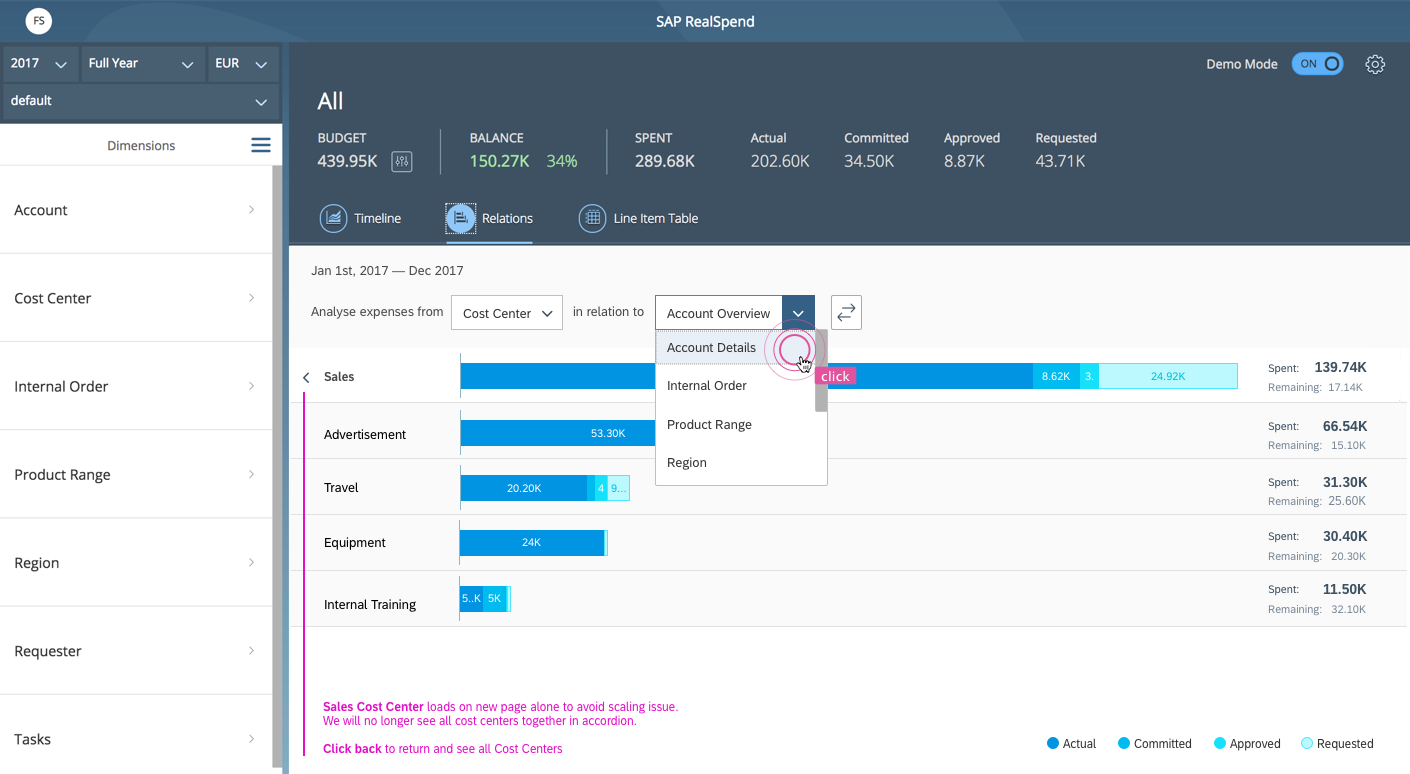
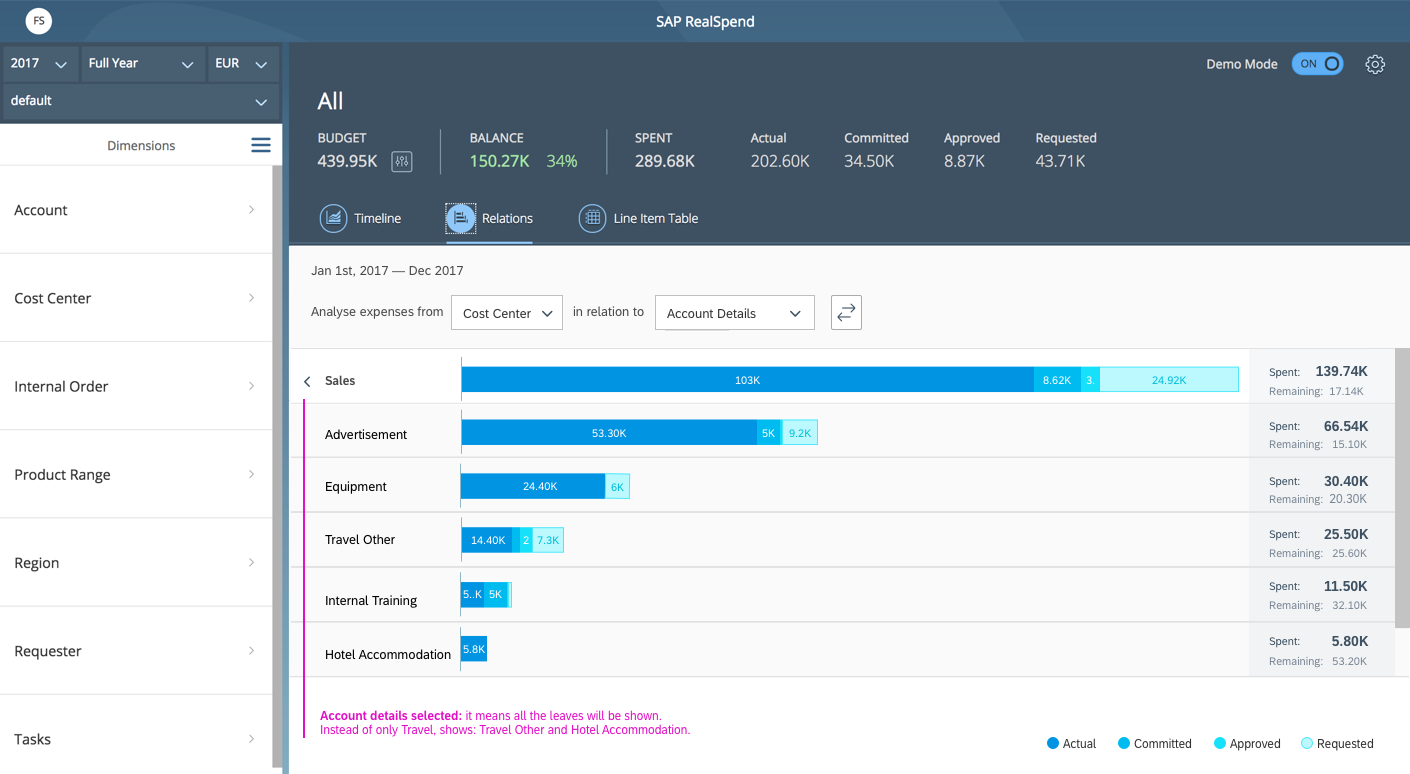
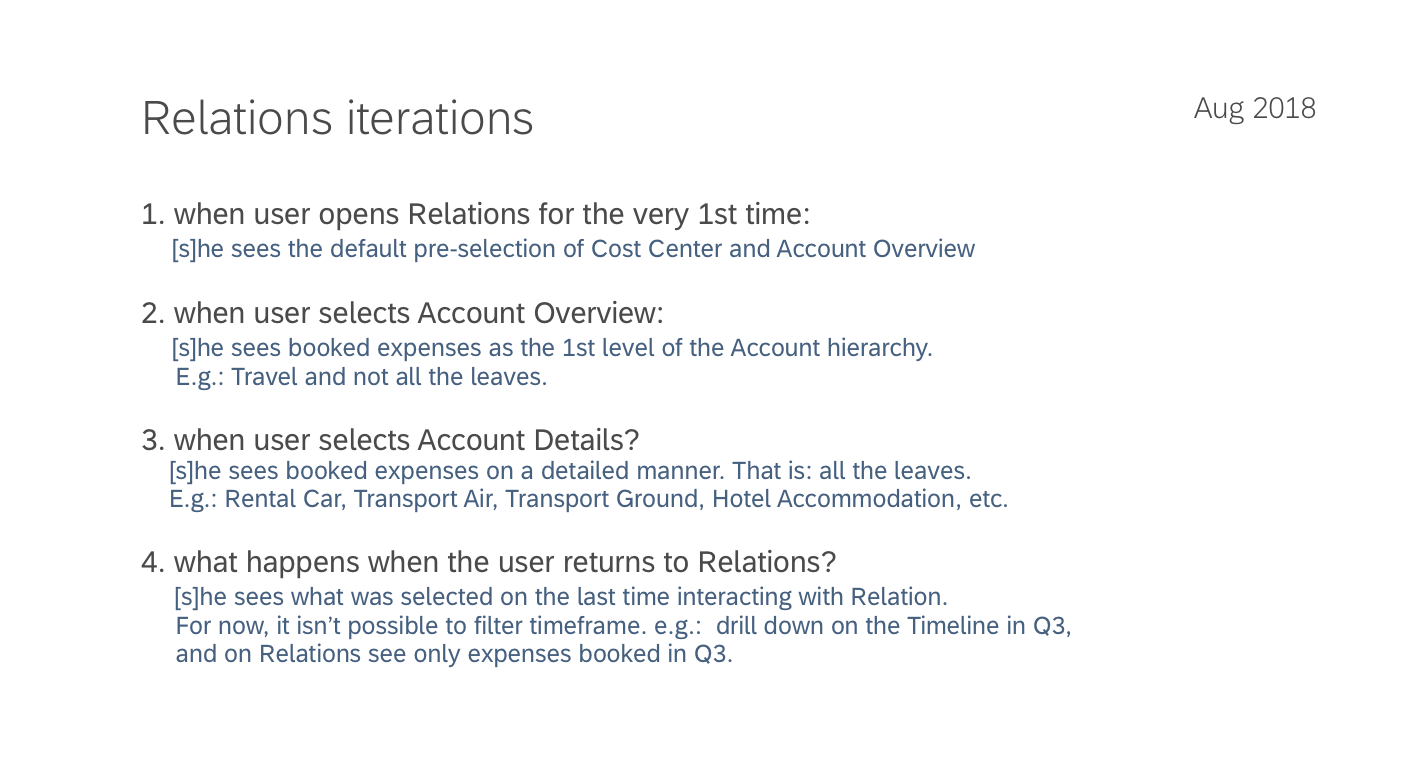
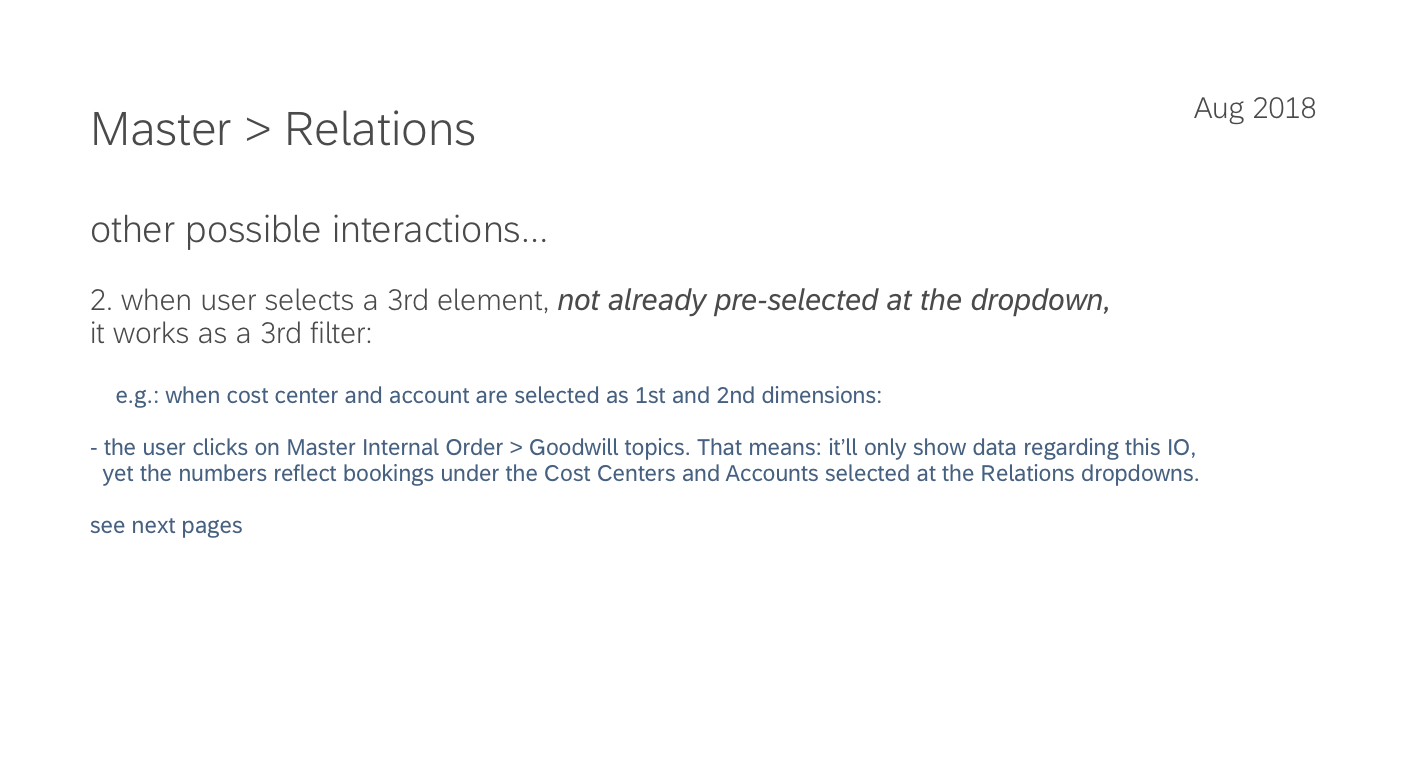
Improvements made on Master – Detail Navigation below.
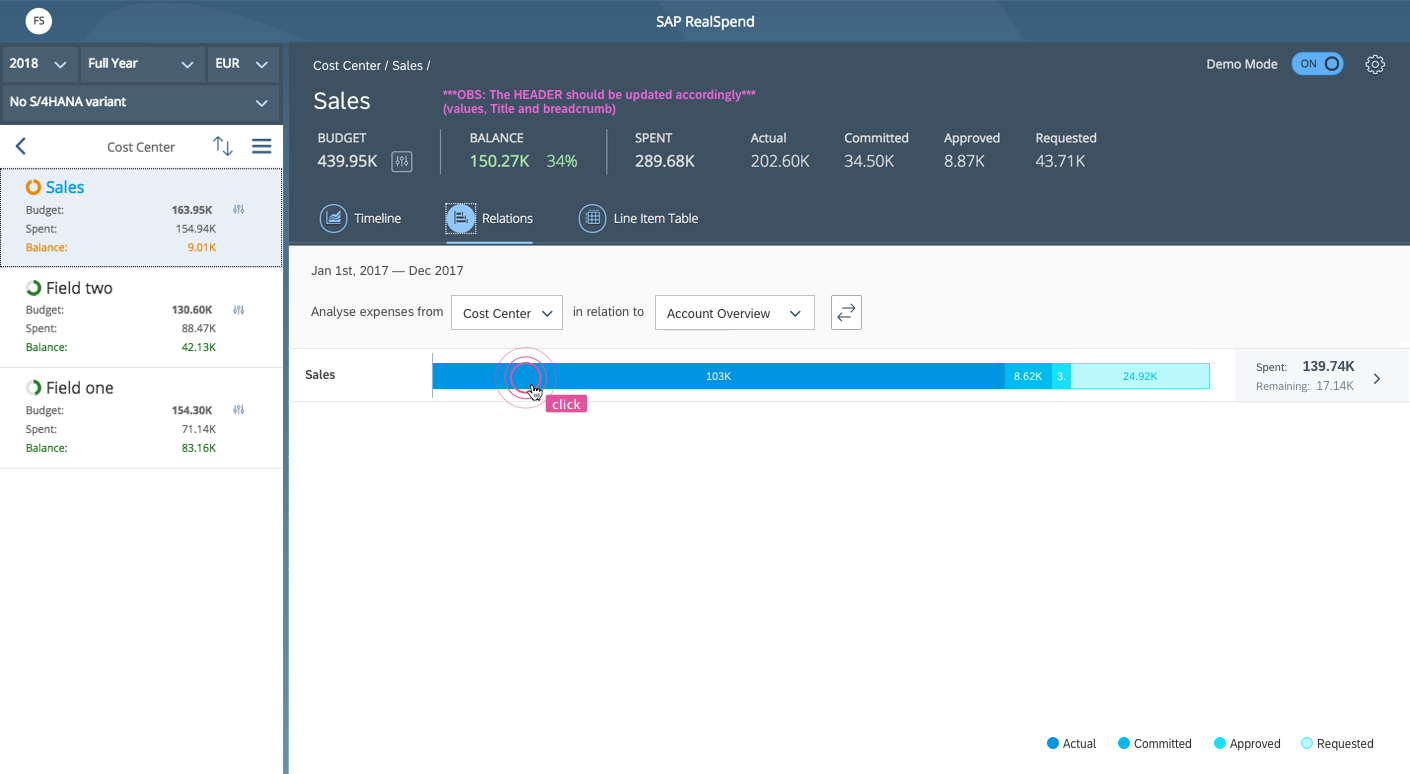
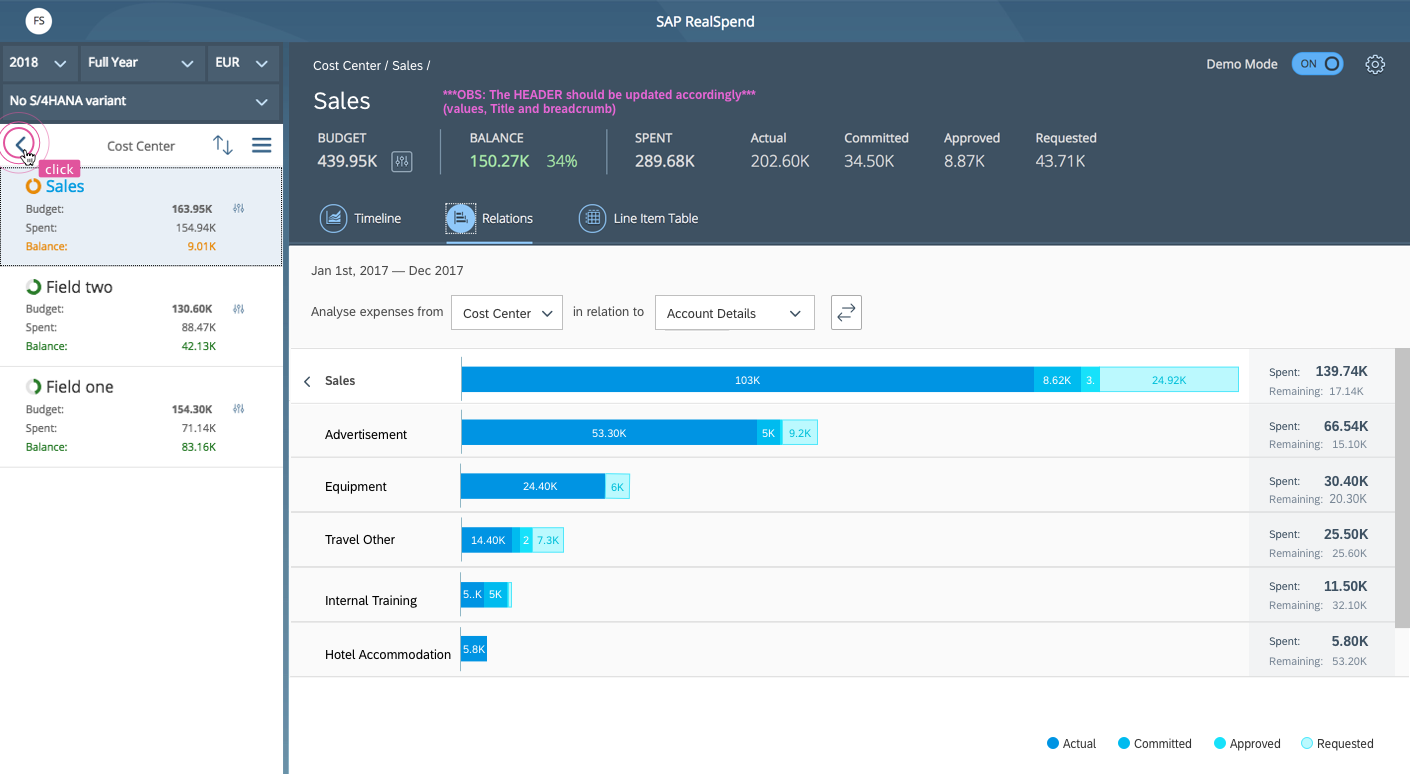
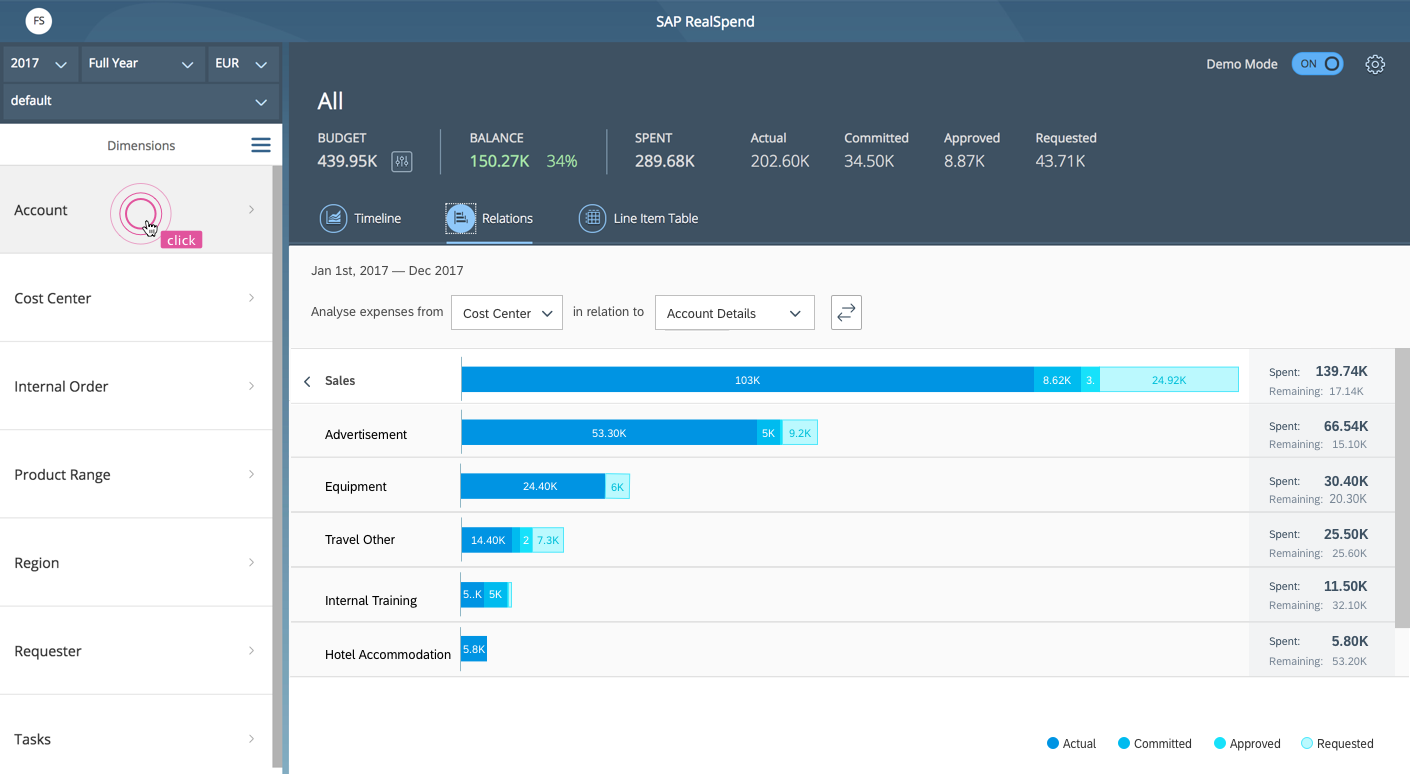
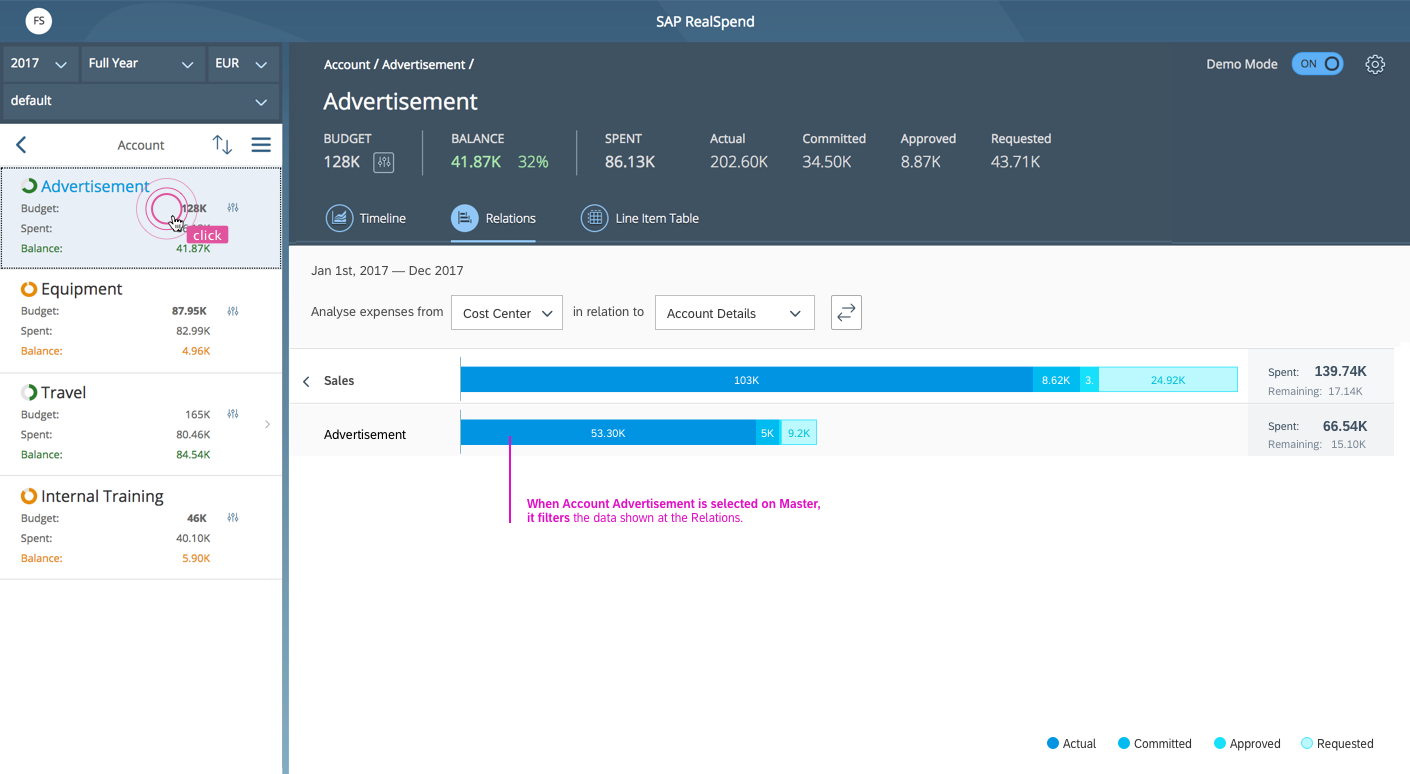
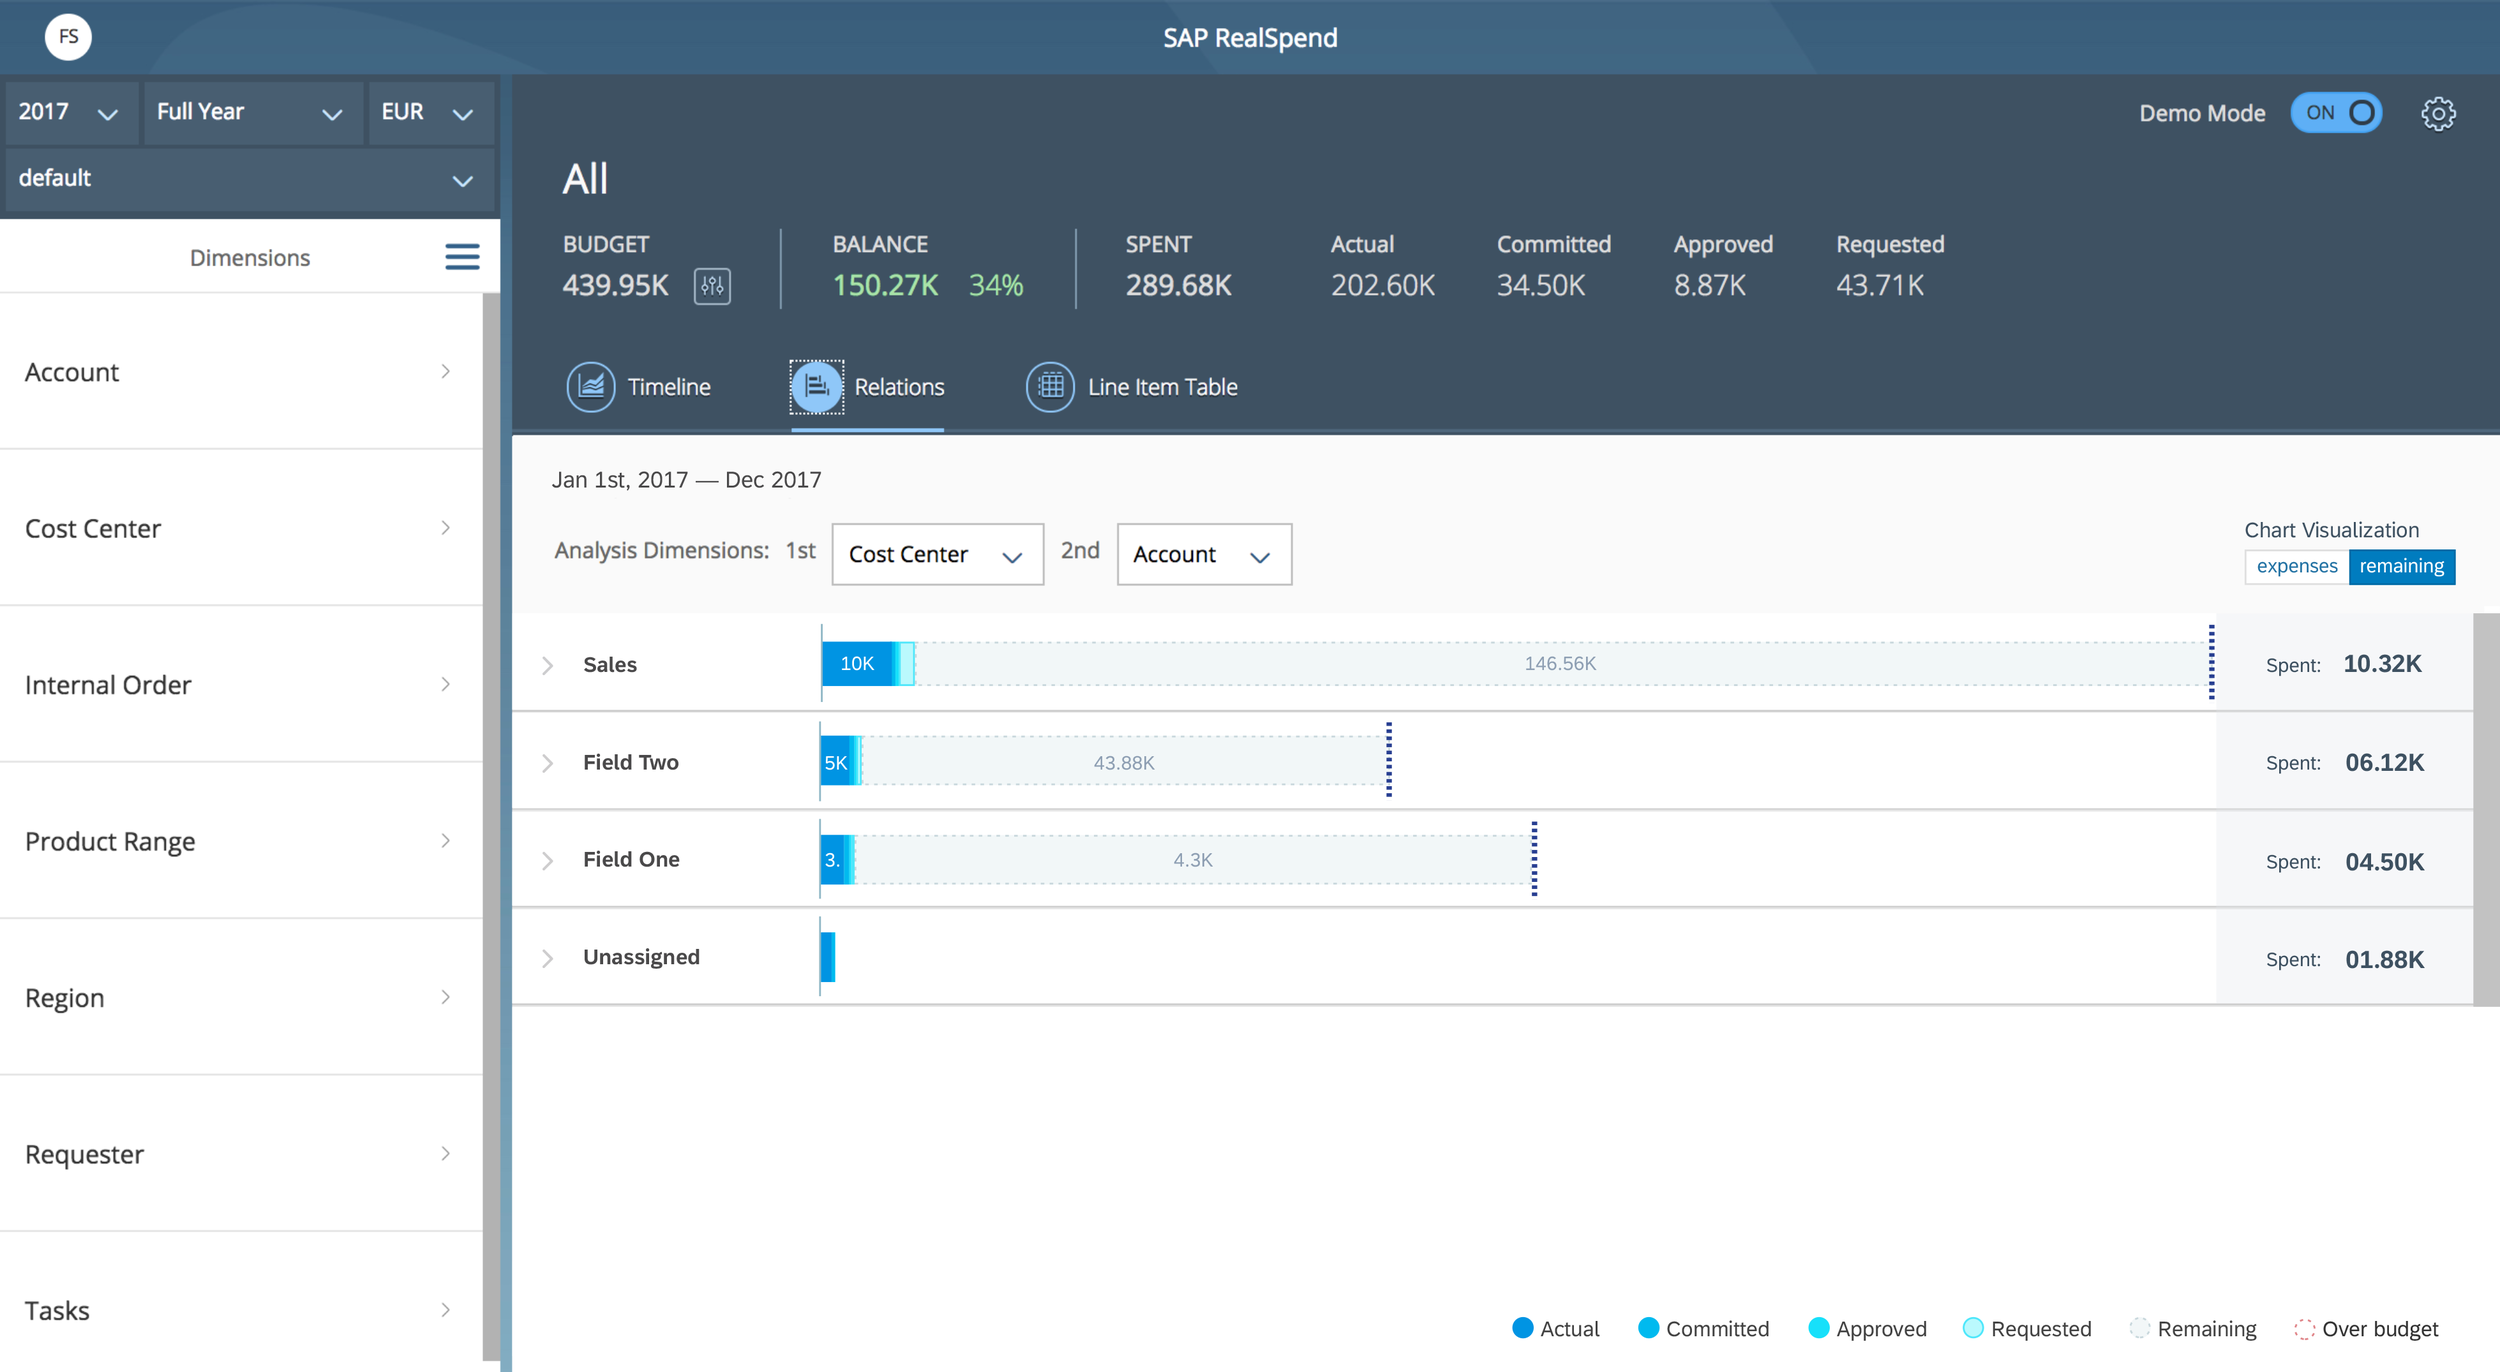
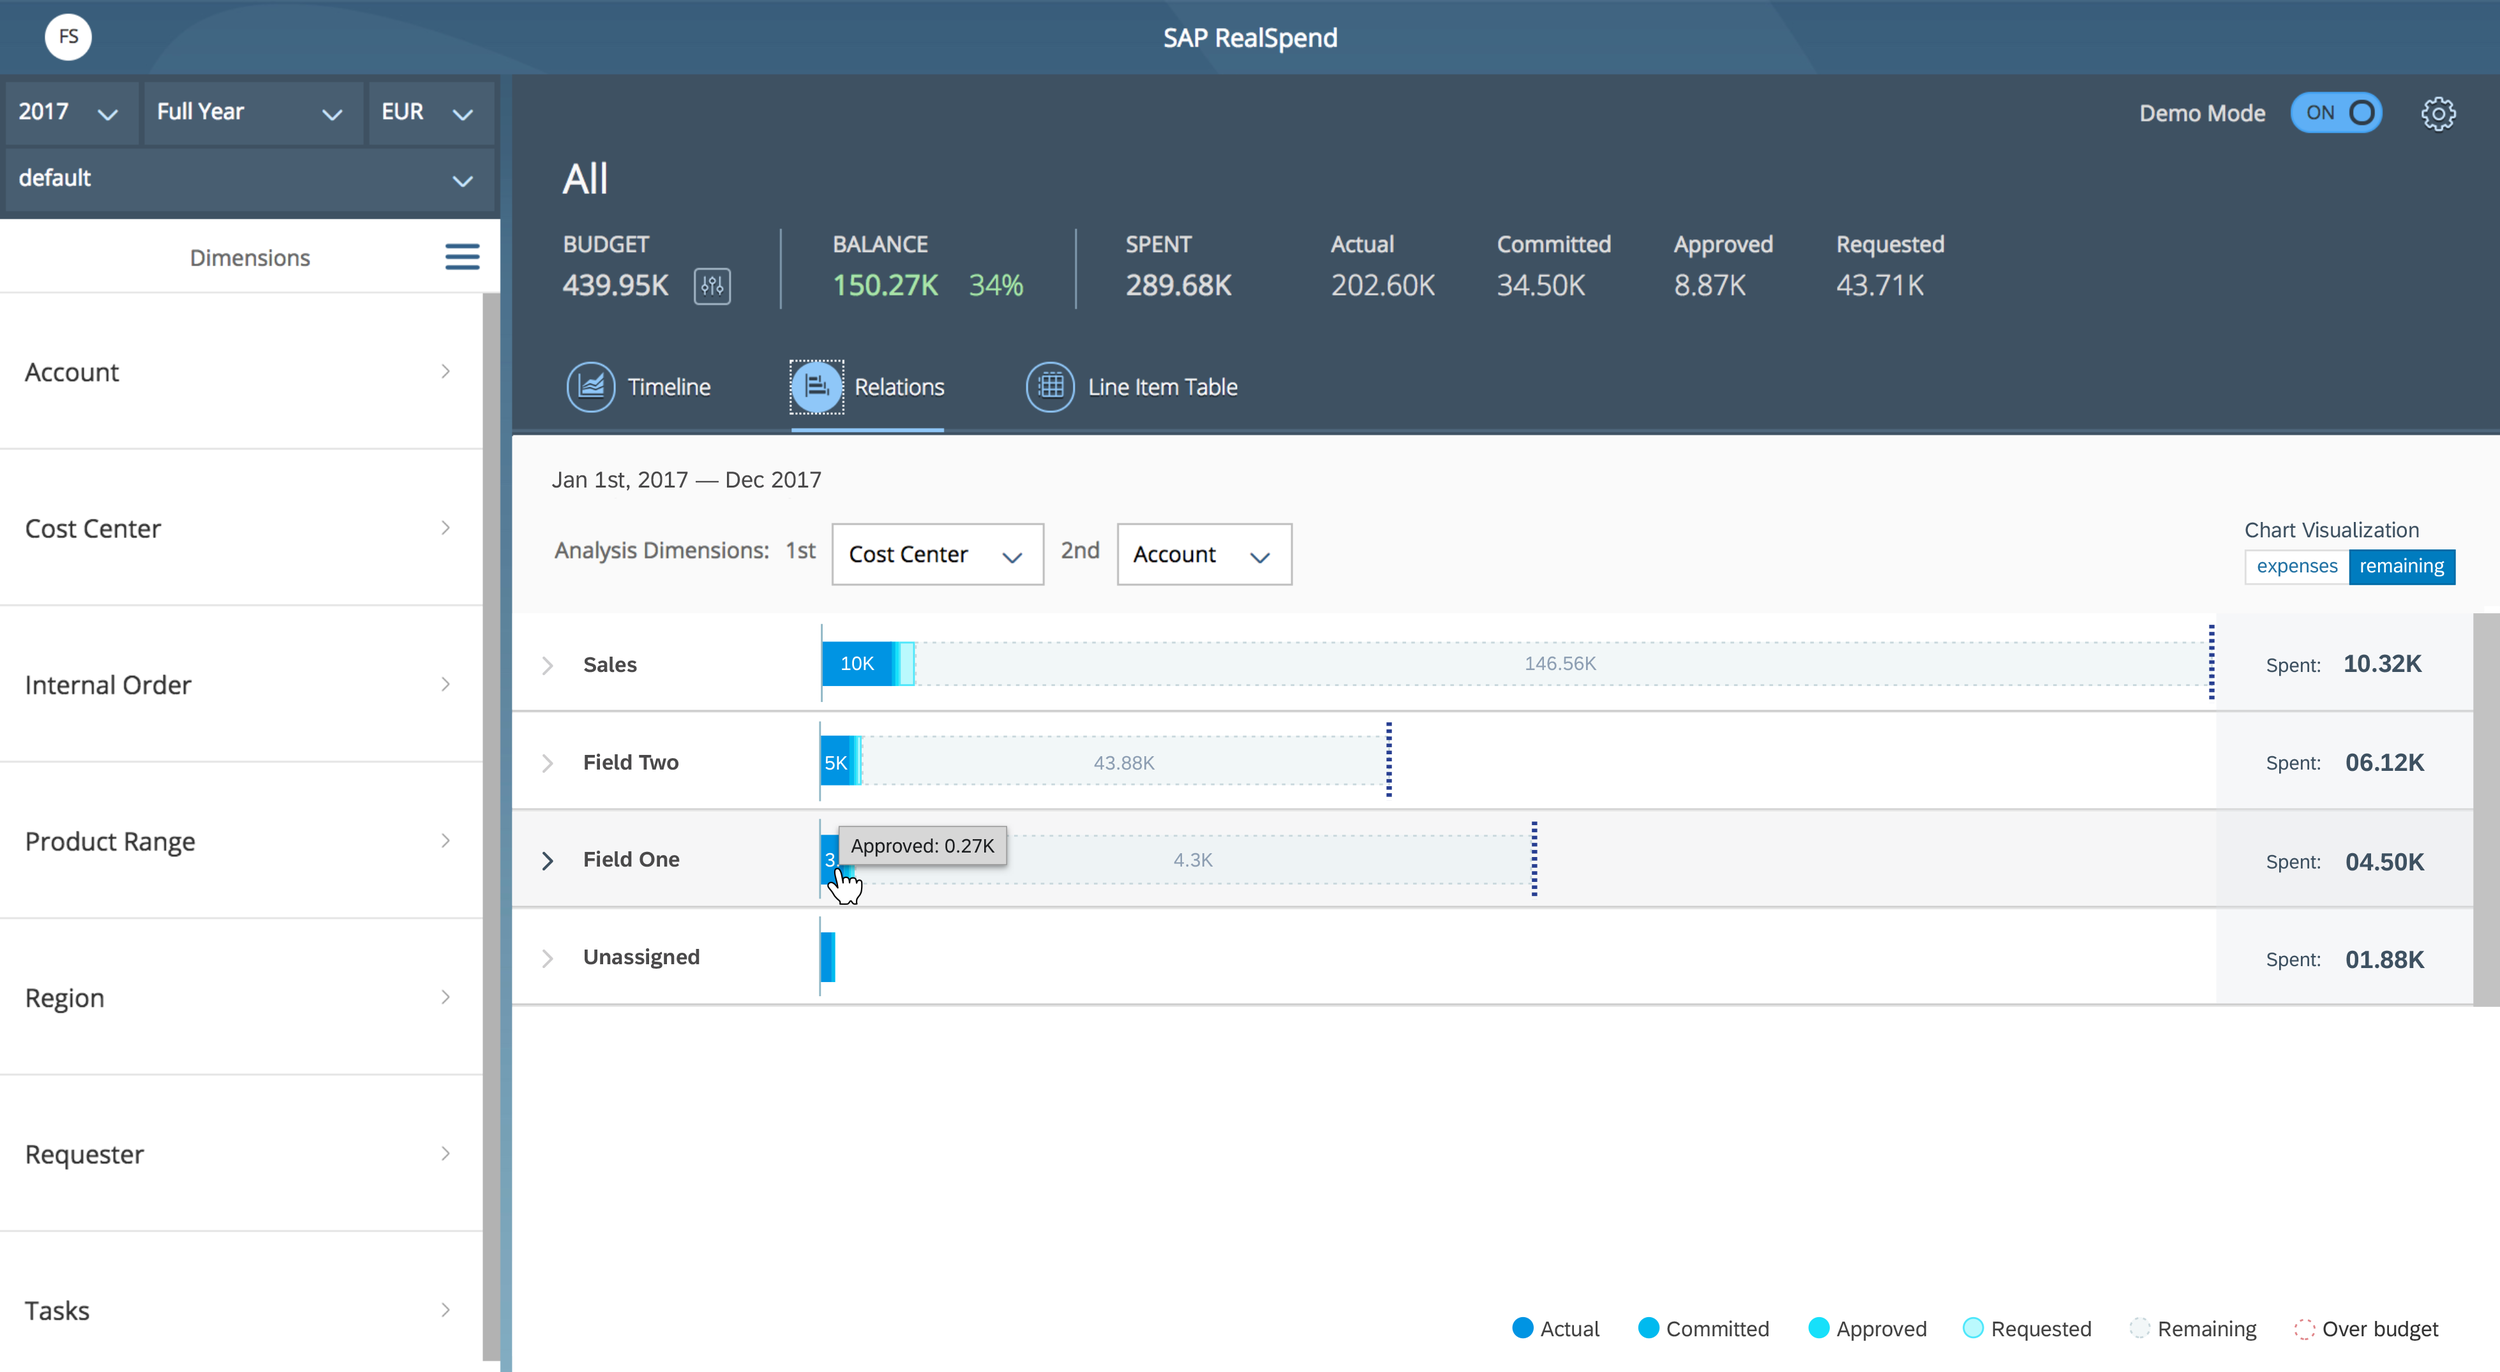
In our feedback loop we understood the edge case of January or Q1 view, when not so many bookings are visible yet in the bar chart.
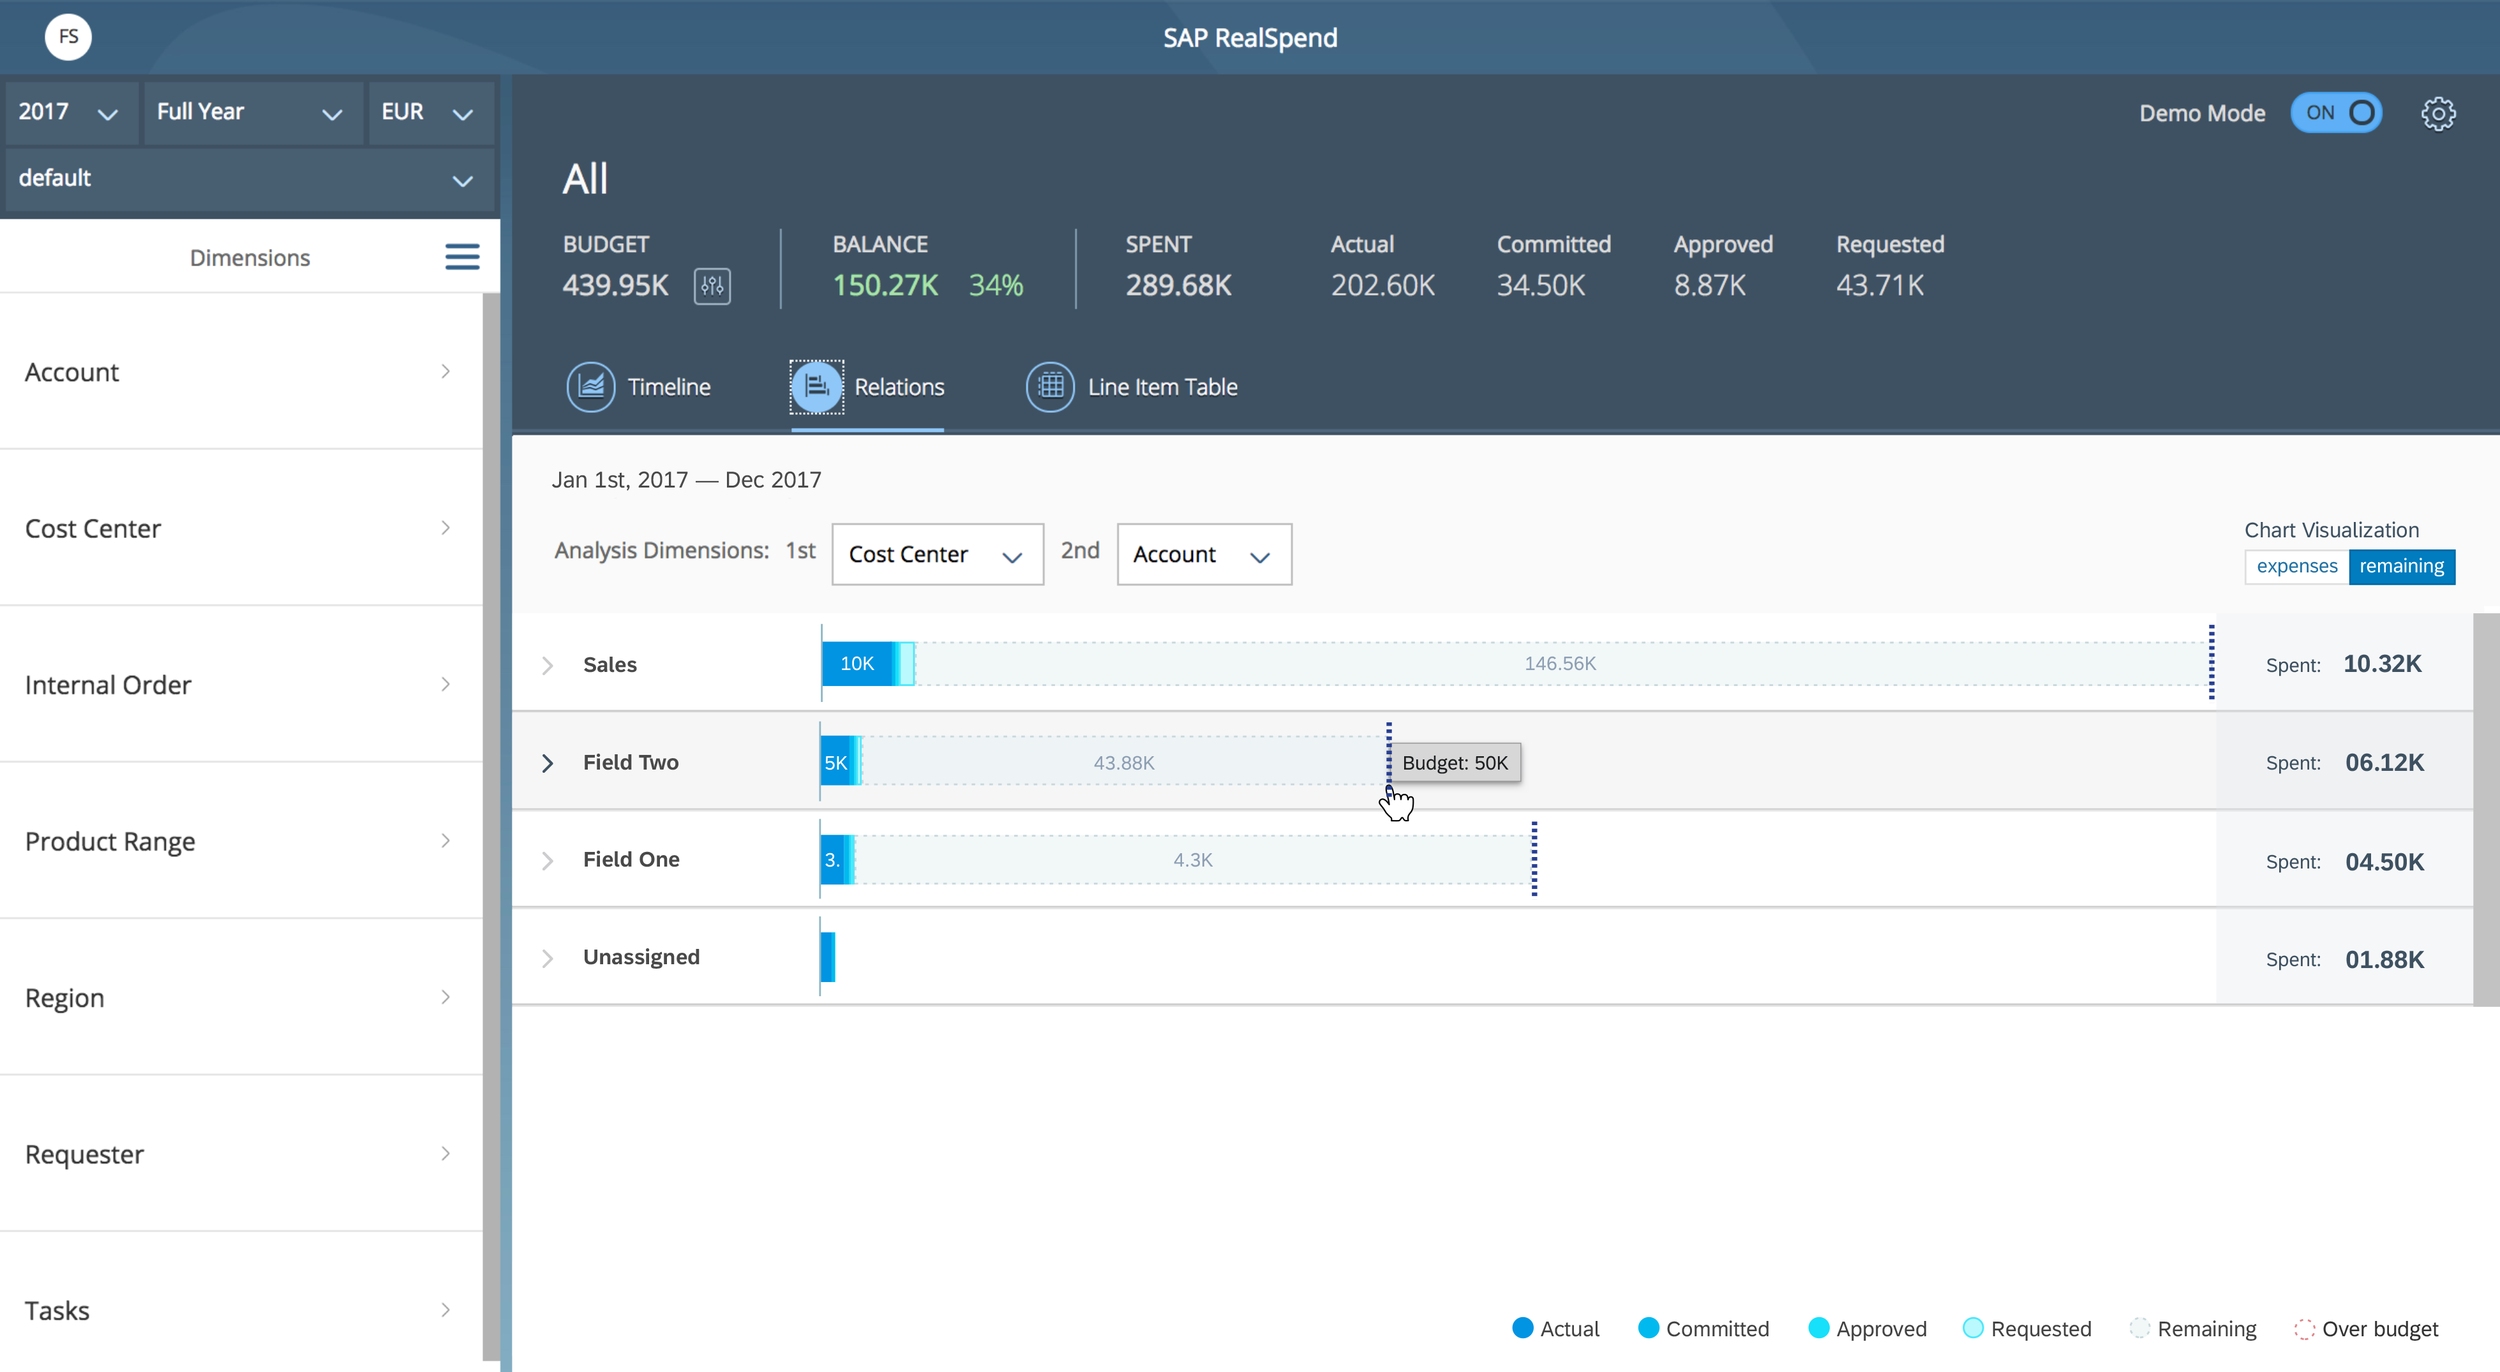
VISUAL DESIGN
Improvements on the colour palette, fast prototyping and tests on negative costs or “start of the year view” were made, in order to inform users via a more pleasant and legible design.
Data Visualisation
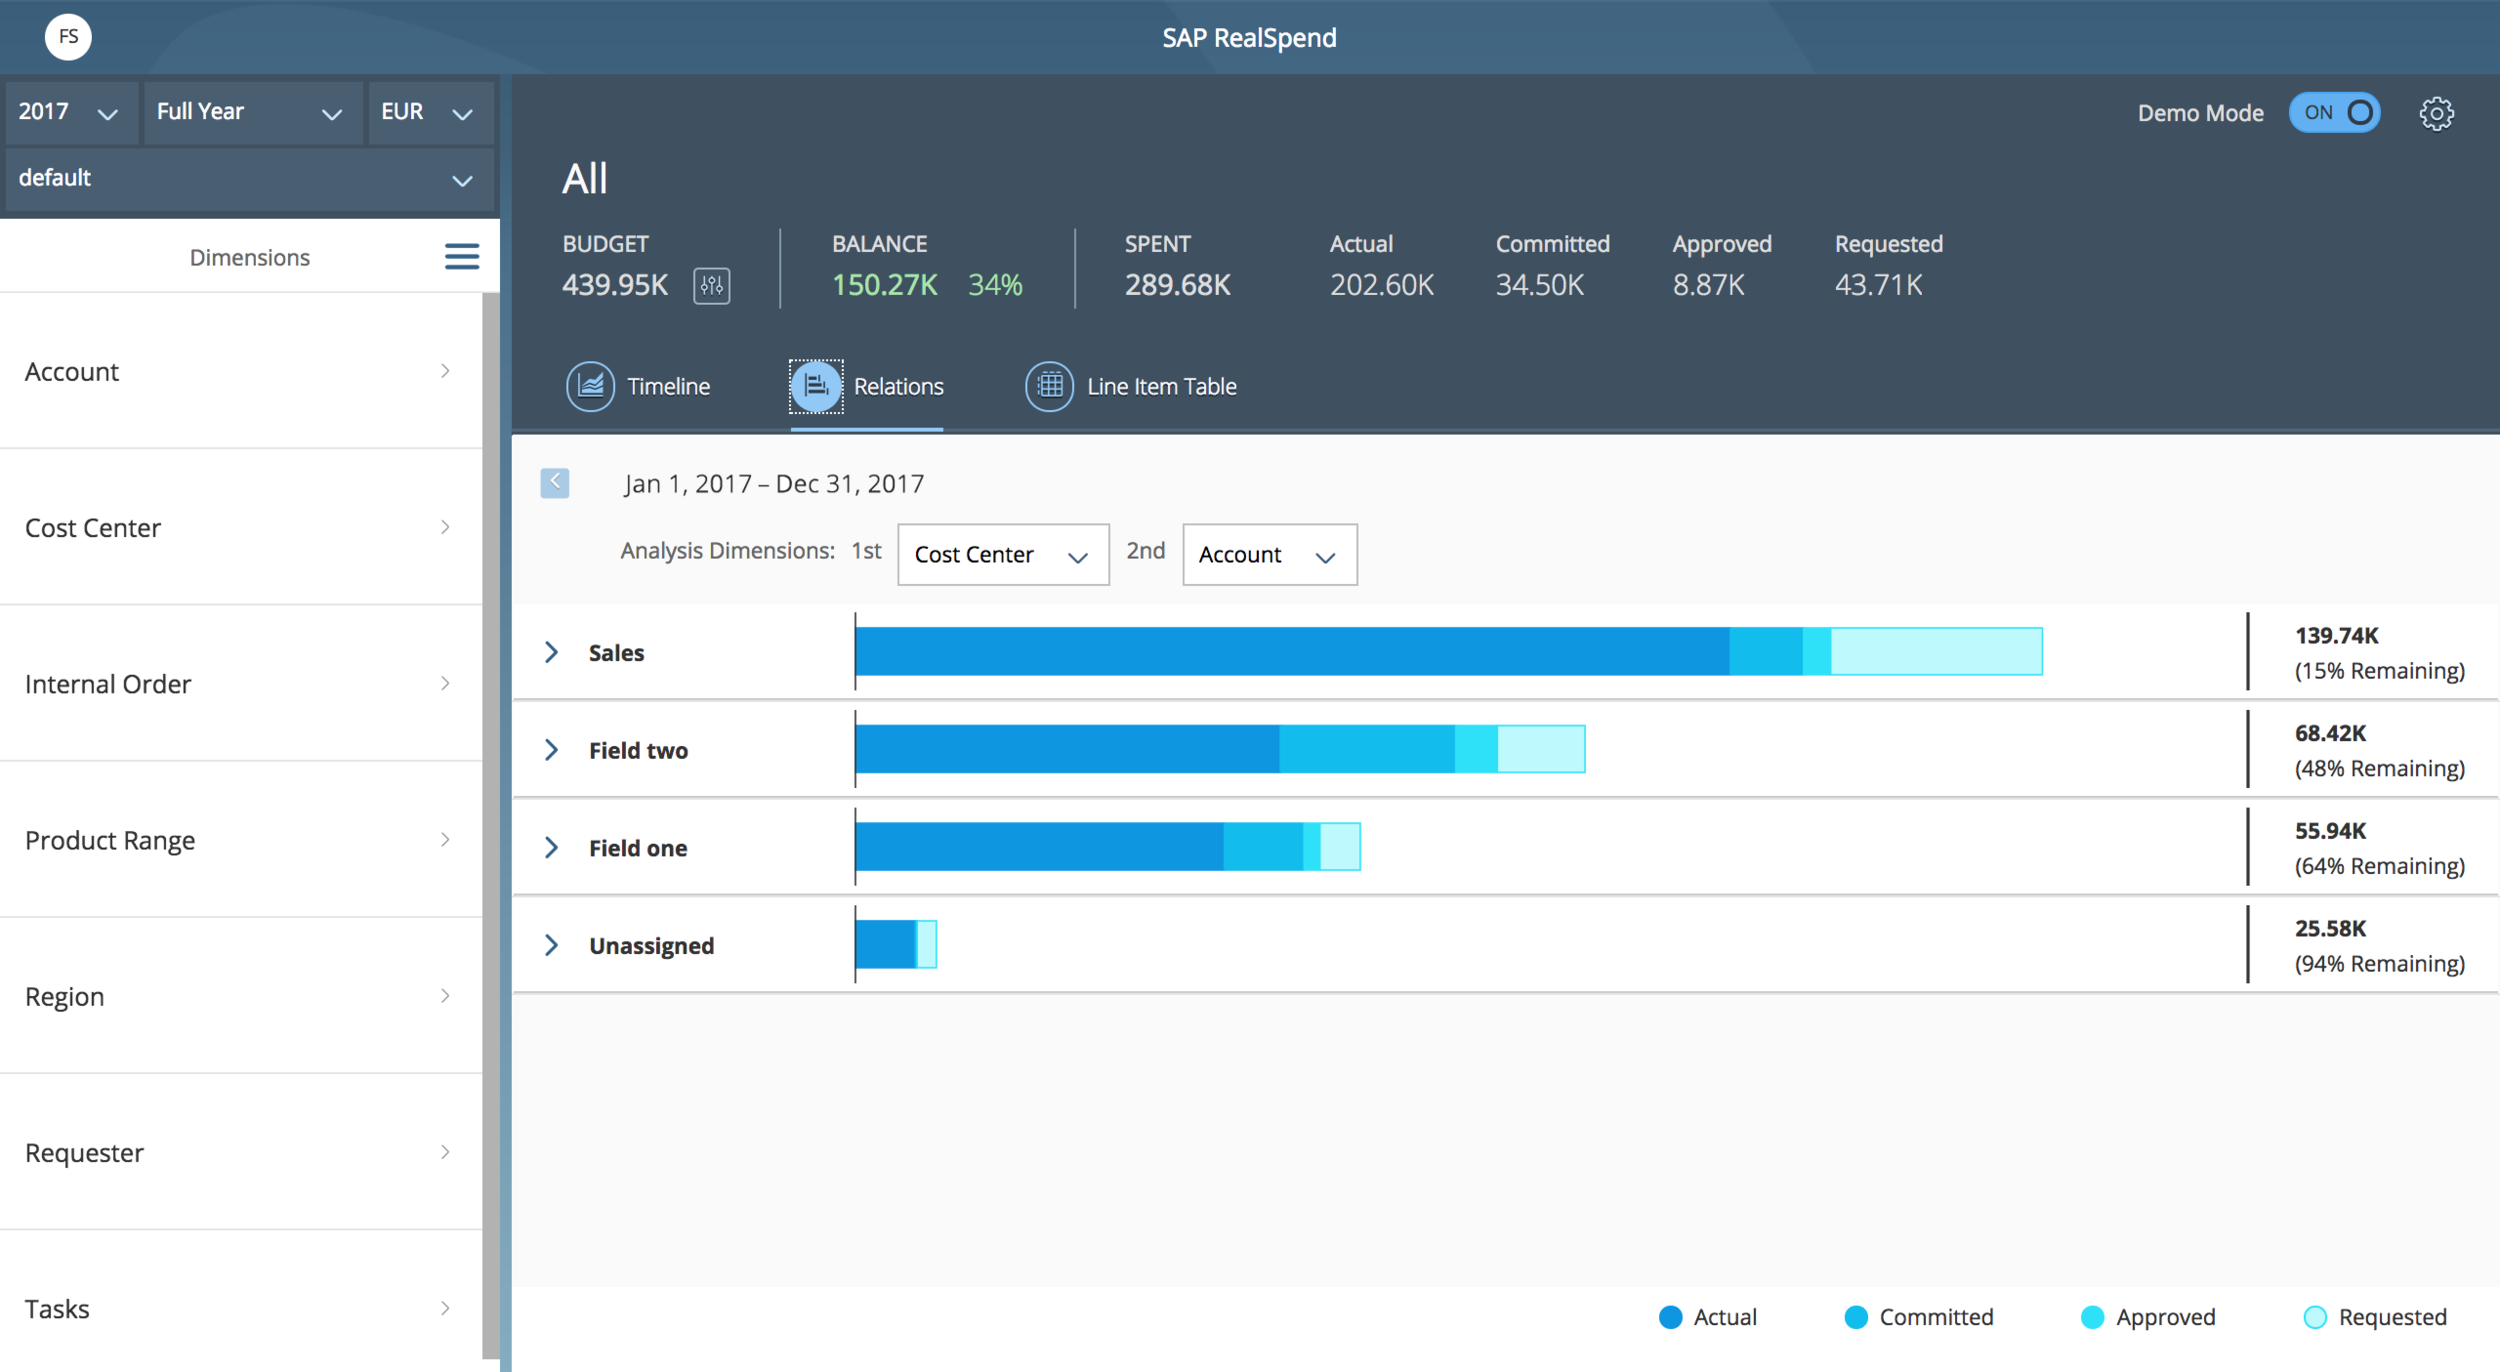
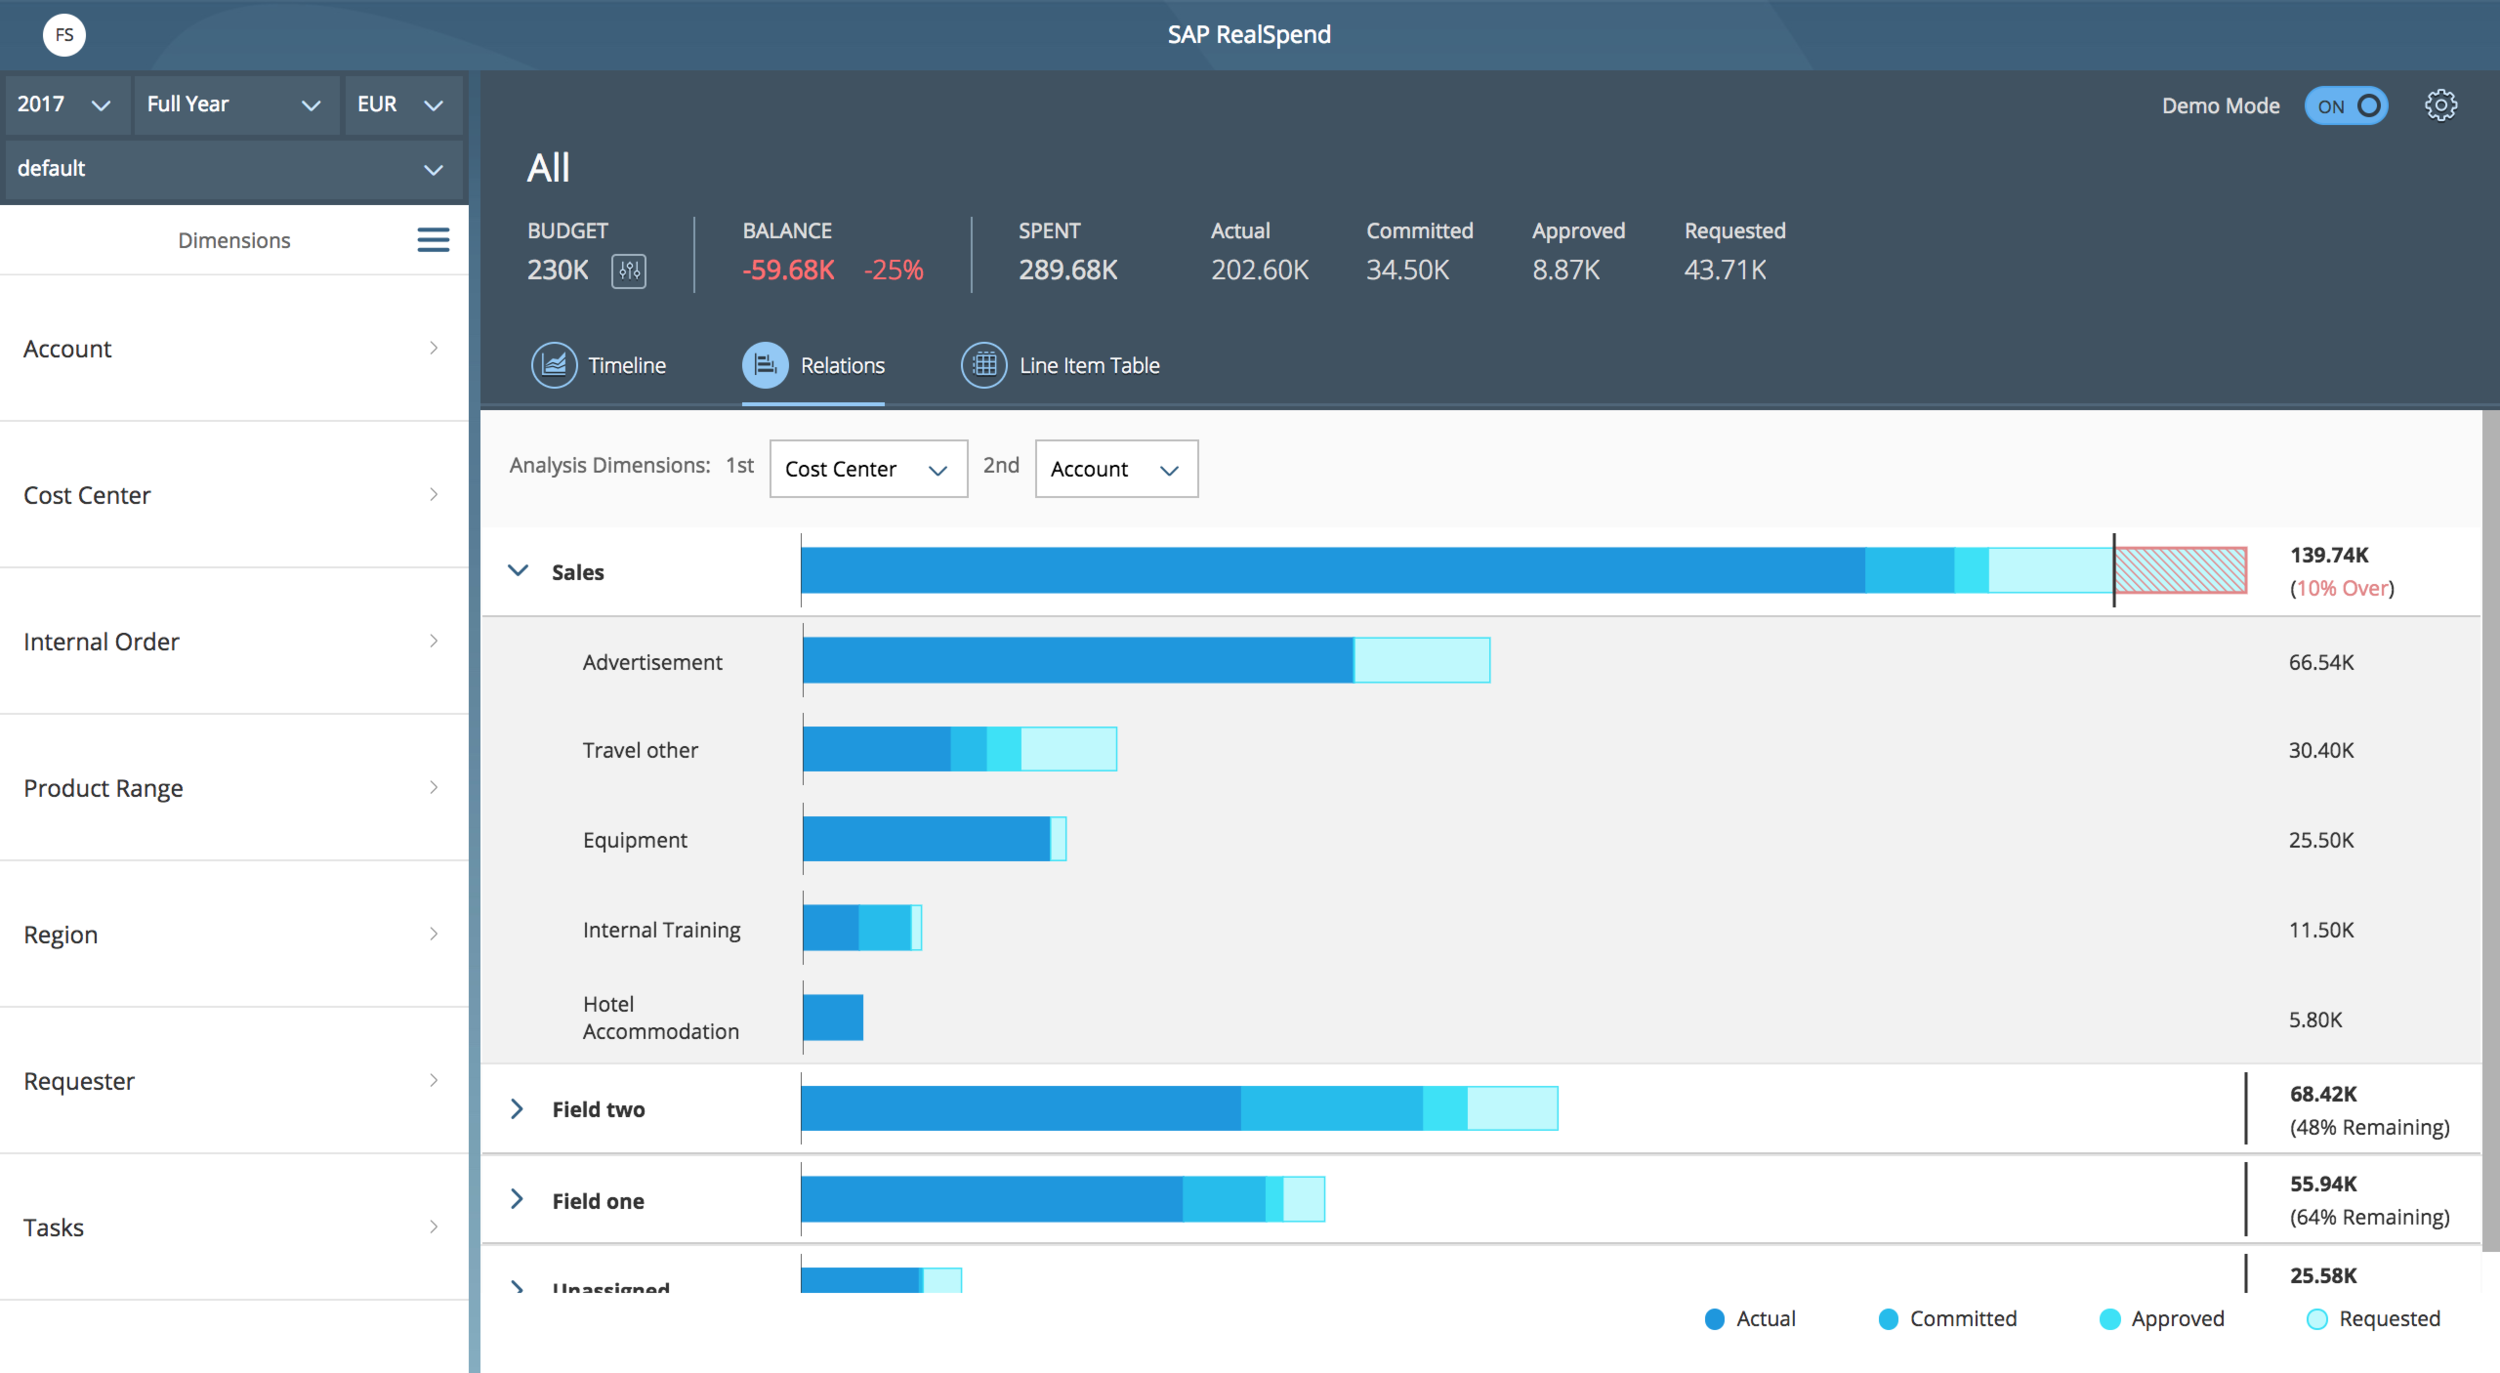
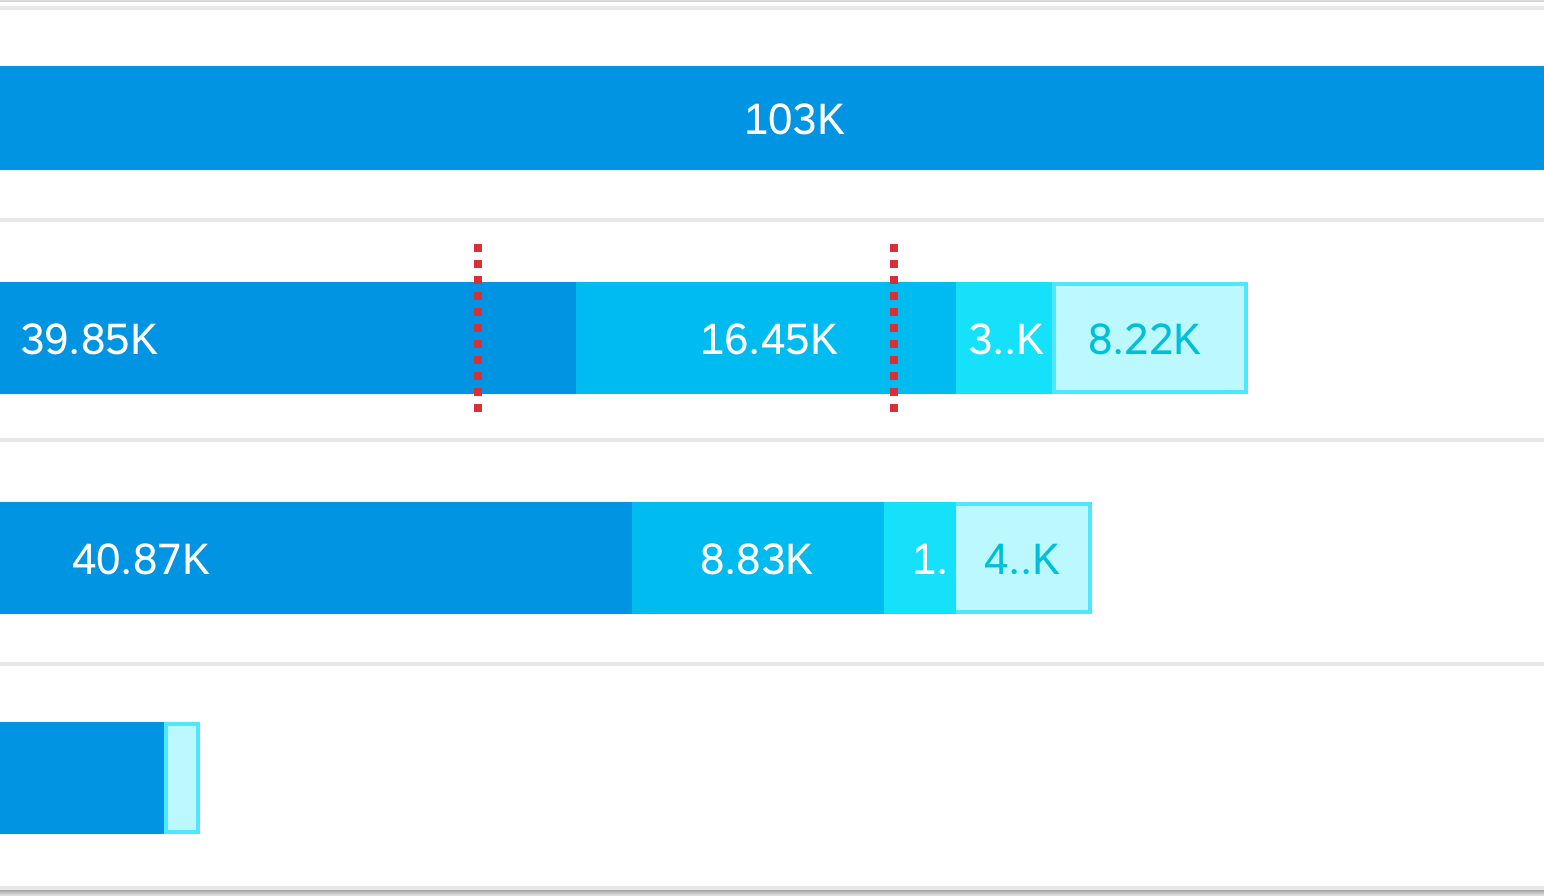
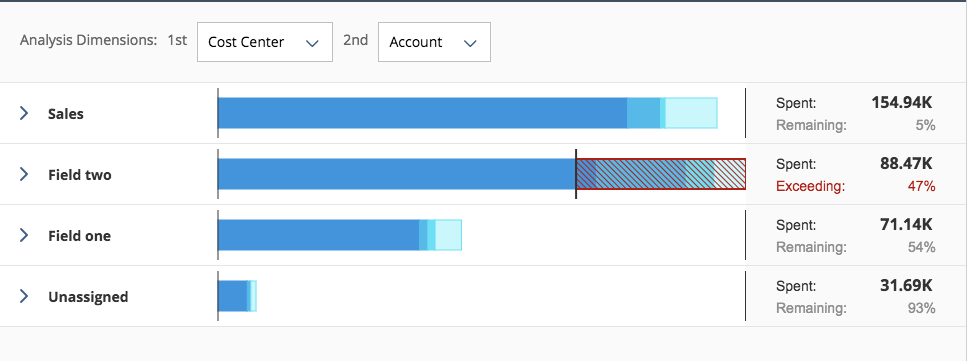
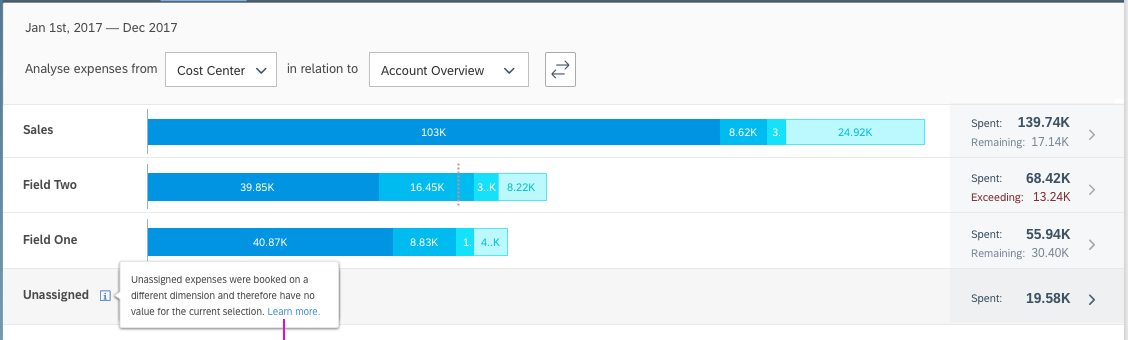
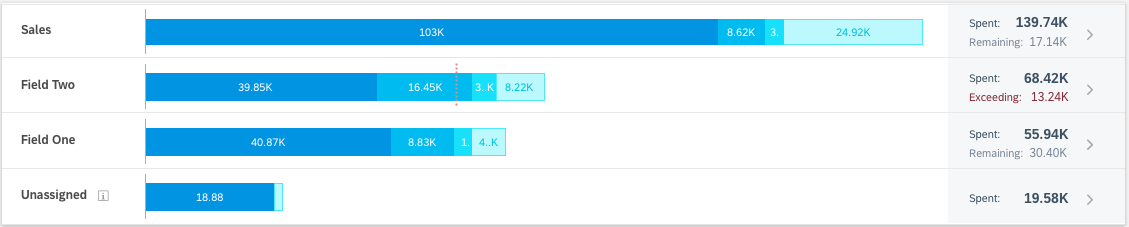
Redesign based on the need of a less granular view of FIN Data
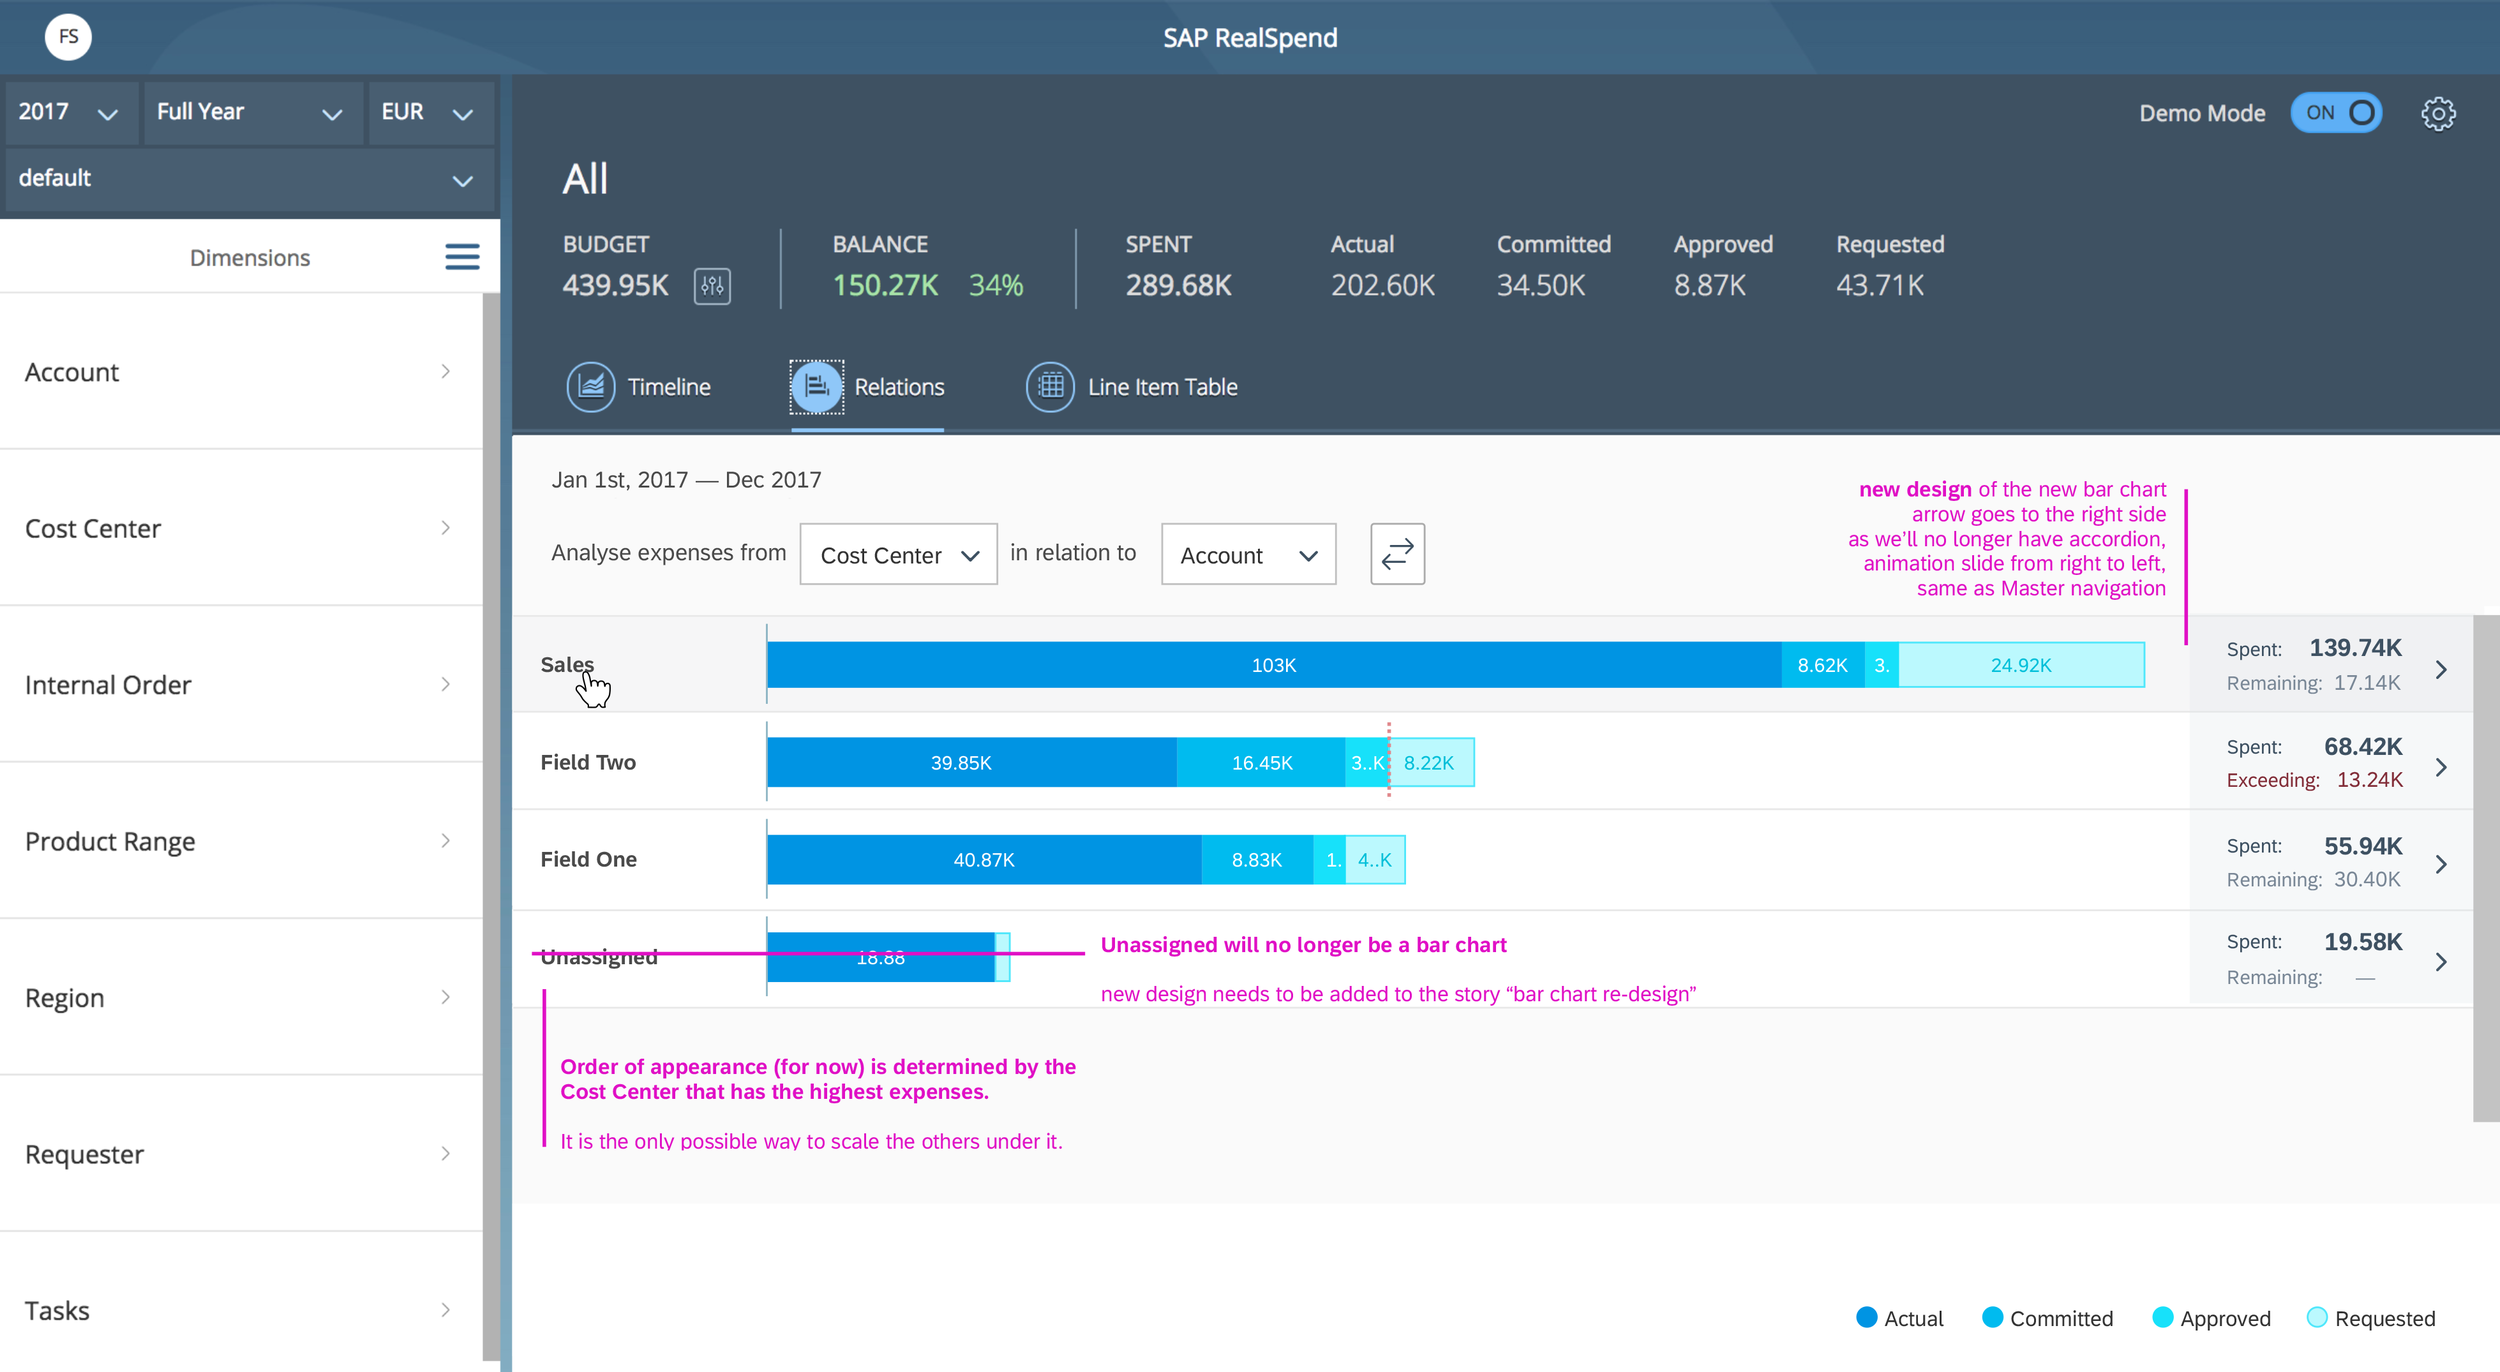
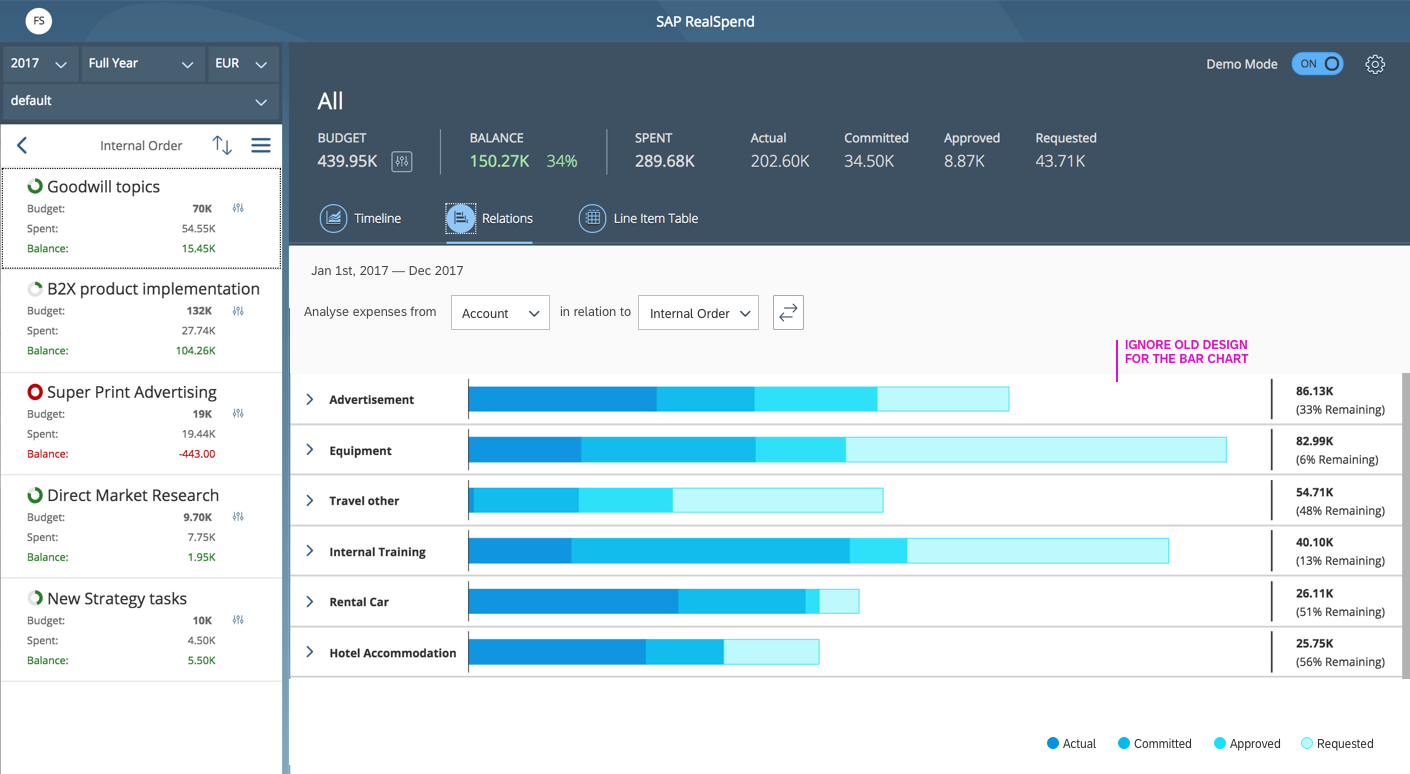
Re-design fixing scaling limitations on our bar chart;
Proposing new colour palette on our bar chart;
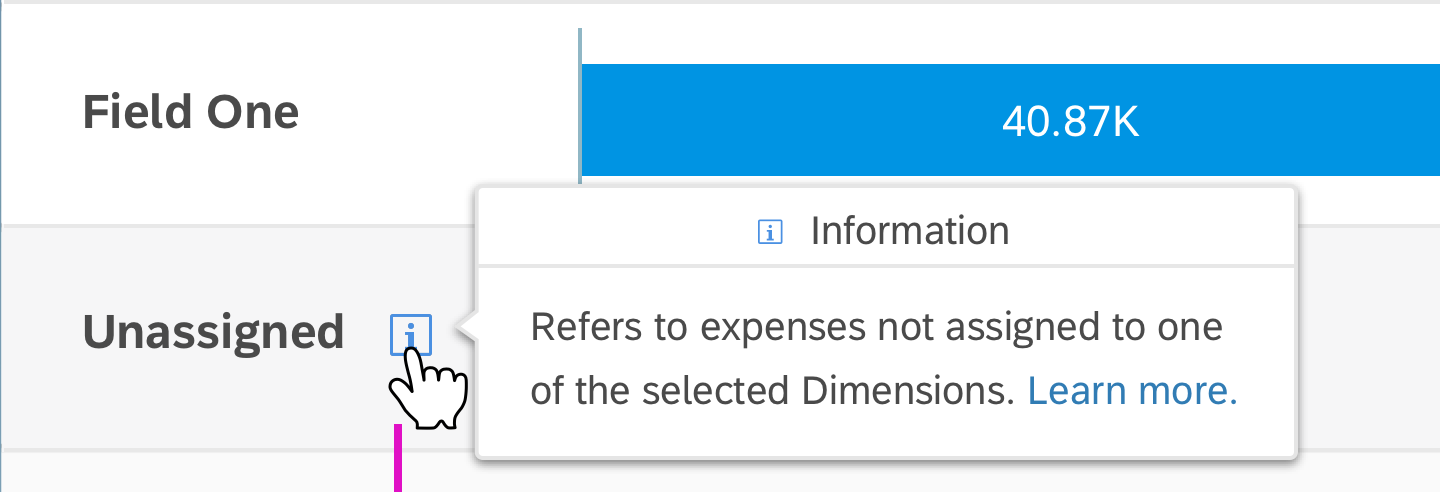
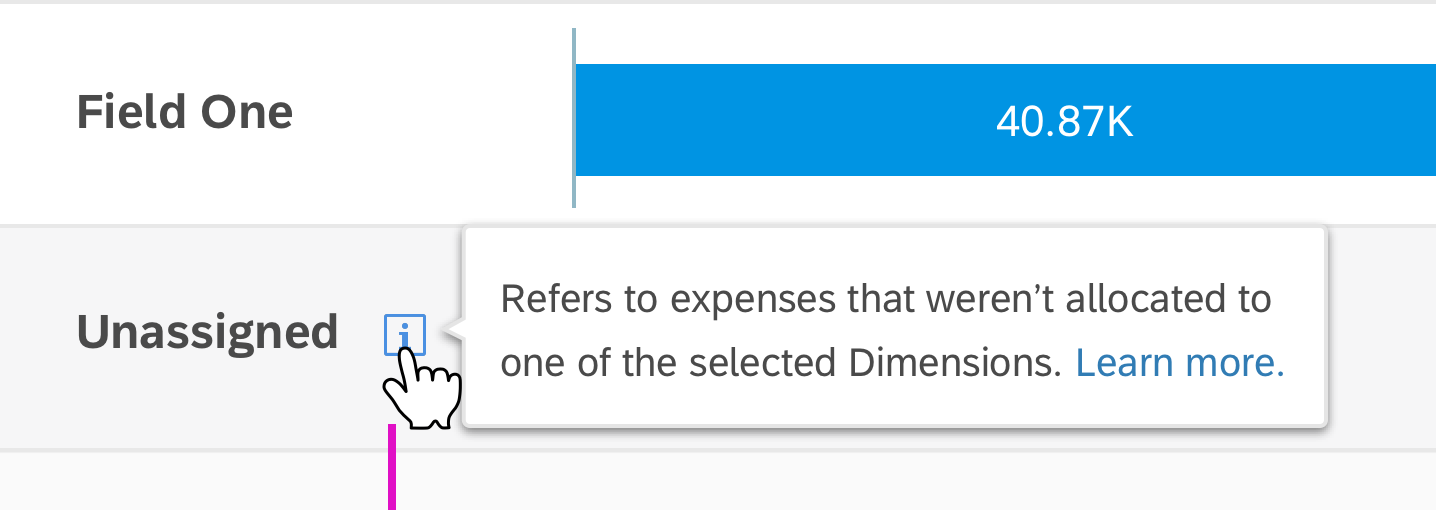
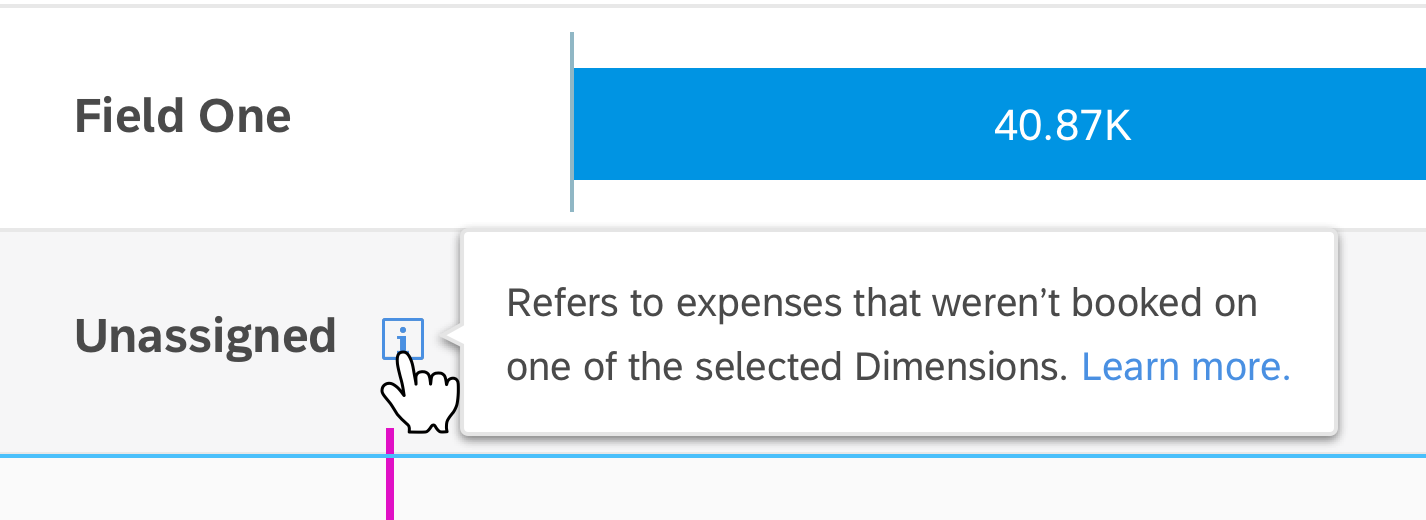
Discarded Versions
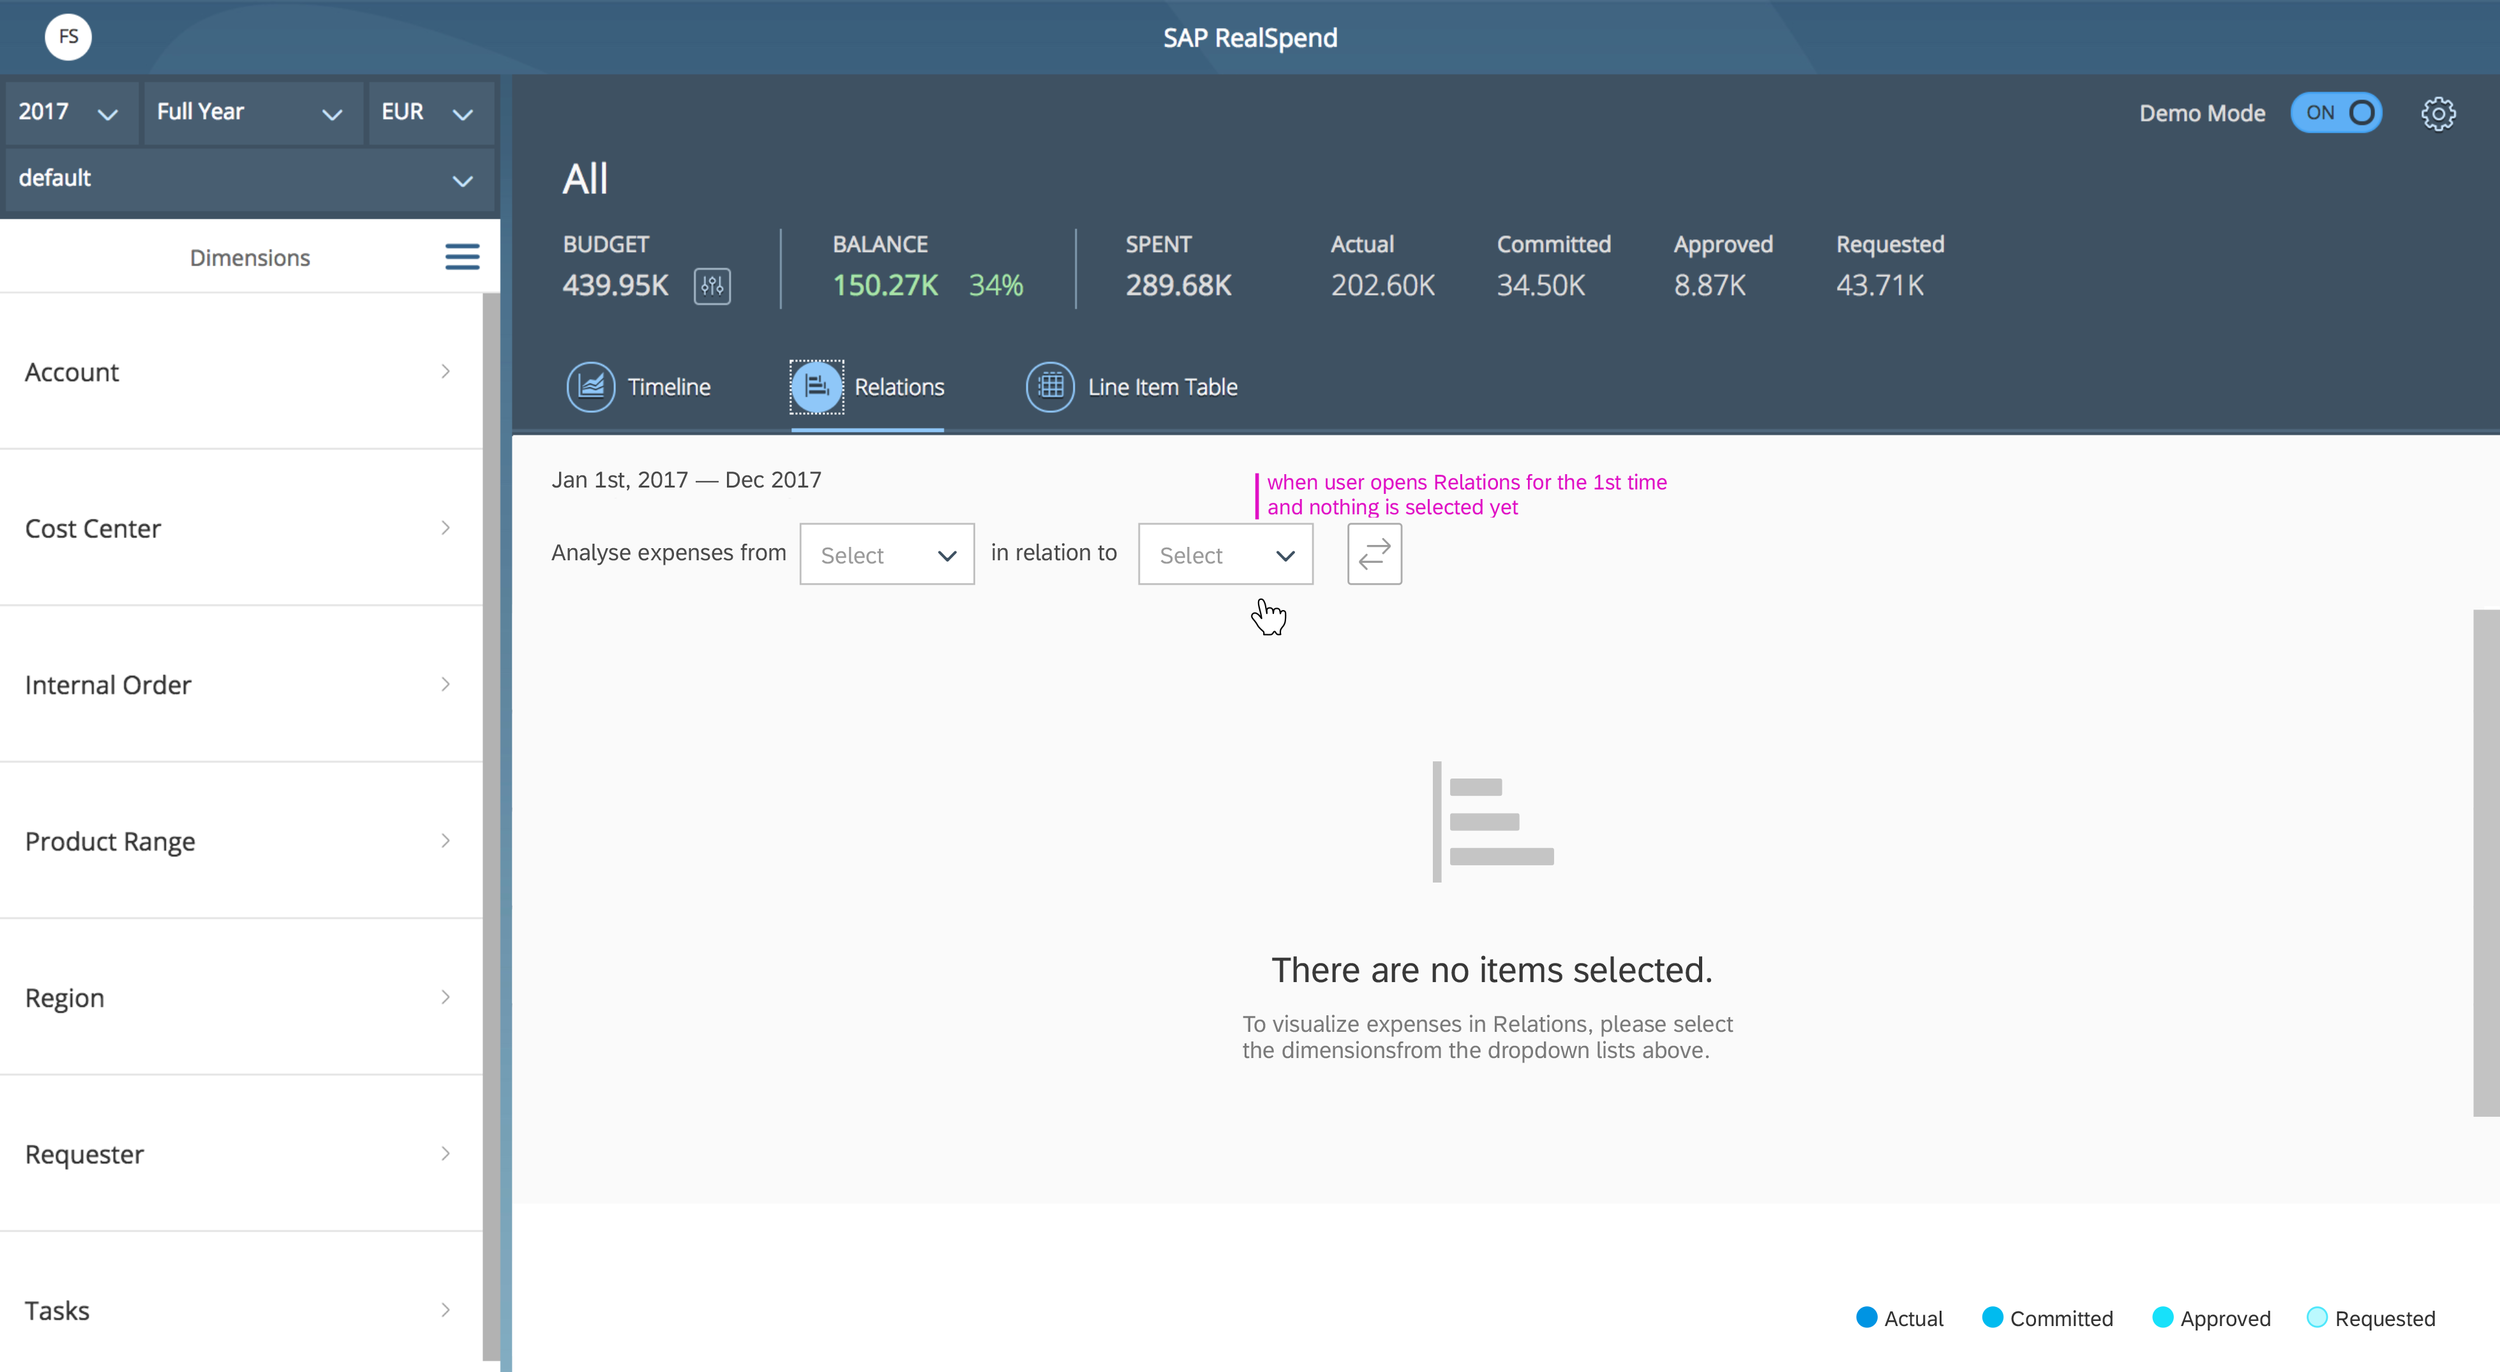

4. Solution Overview
After several validation sessions and re-designs we closed our Expenses Relations View as one of the most celebrated features in RealSpend.
Functionality: The Expenses Relation feature enhances the way users visualise their expenses, giving the opportunity of relating one dimension to another. As a data vizualization improvement users could choose between “Overview” and “Details” as in our research we learned that extreme granularity in FIN Operational Data often wasn’t needed, for this goal. That enhanced the way they report and communicate their figures quarterly or annually. Mostly because they commit decisions based on live-data, they will avoid mistaken or overlapping figures.
Media and Context: Desktop for most of the analysis, where complex data and drill downs are needed.
Rewards: Ease of use and effective data visualisation results, less granular when needed. Less elements on screen with a more intuitive drill down to Line Item table level with navigation and scaling improvements achieved.