
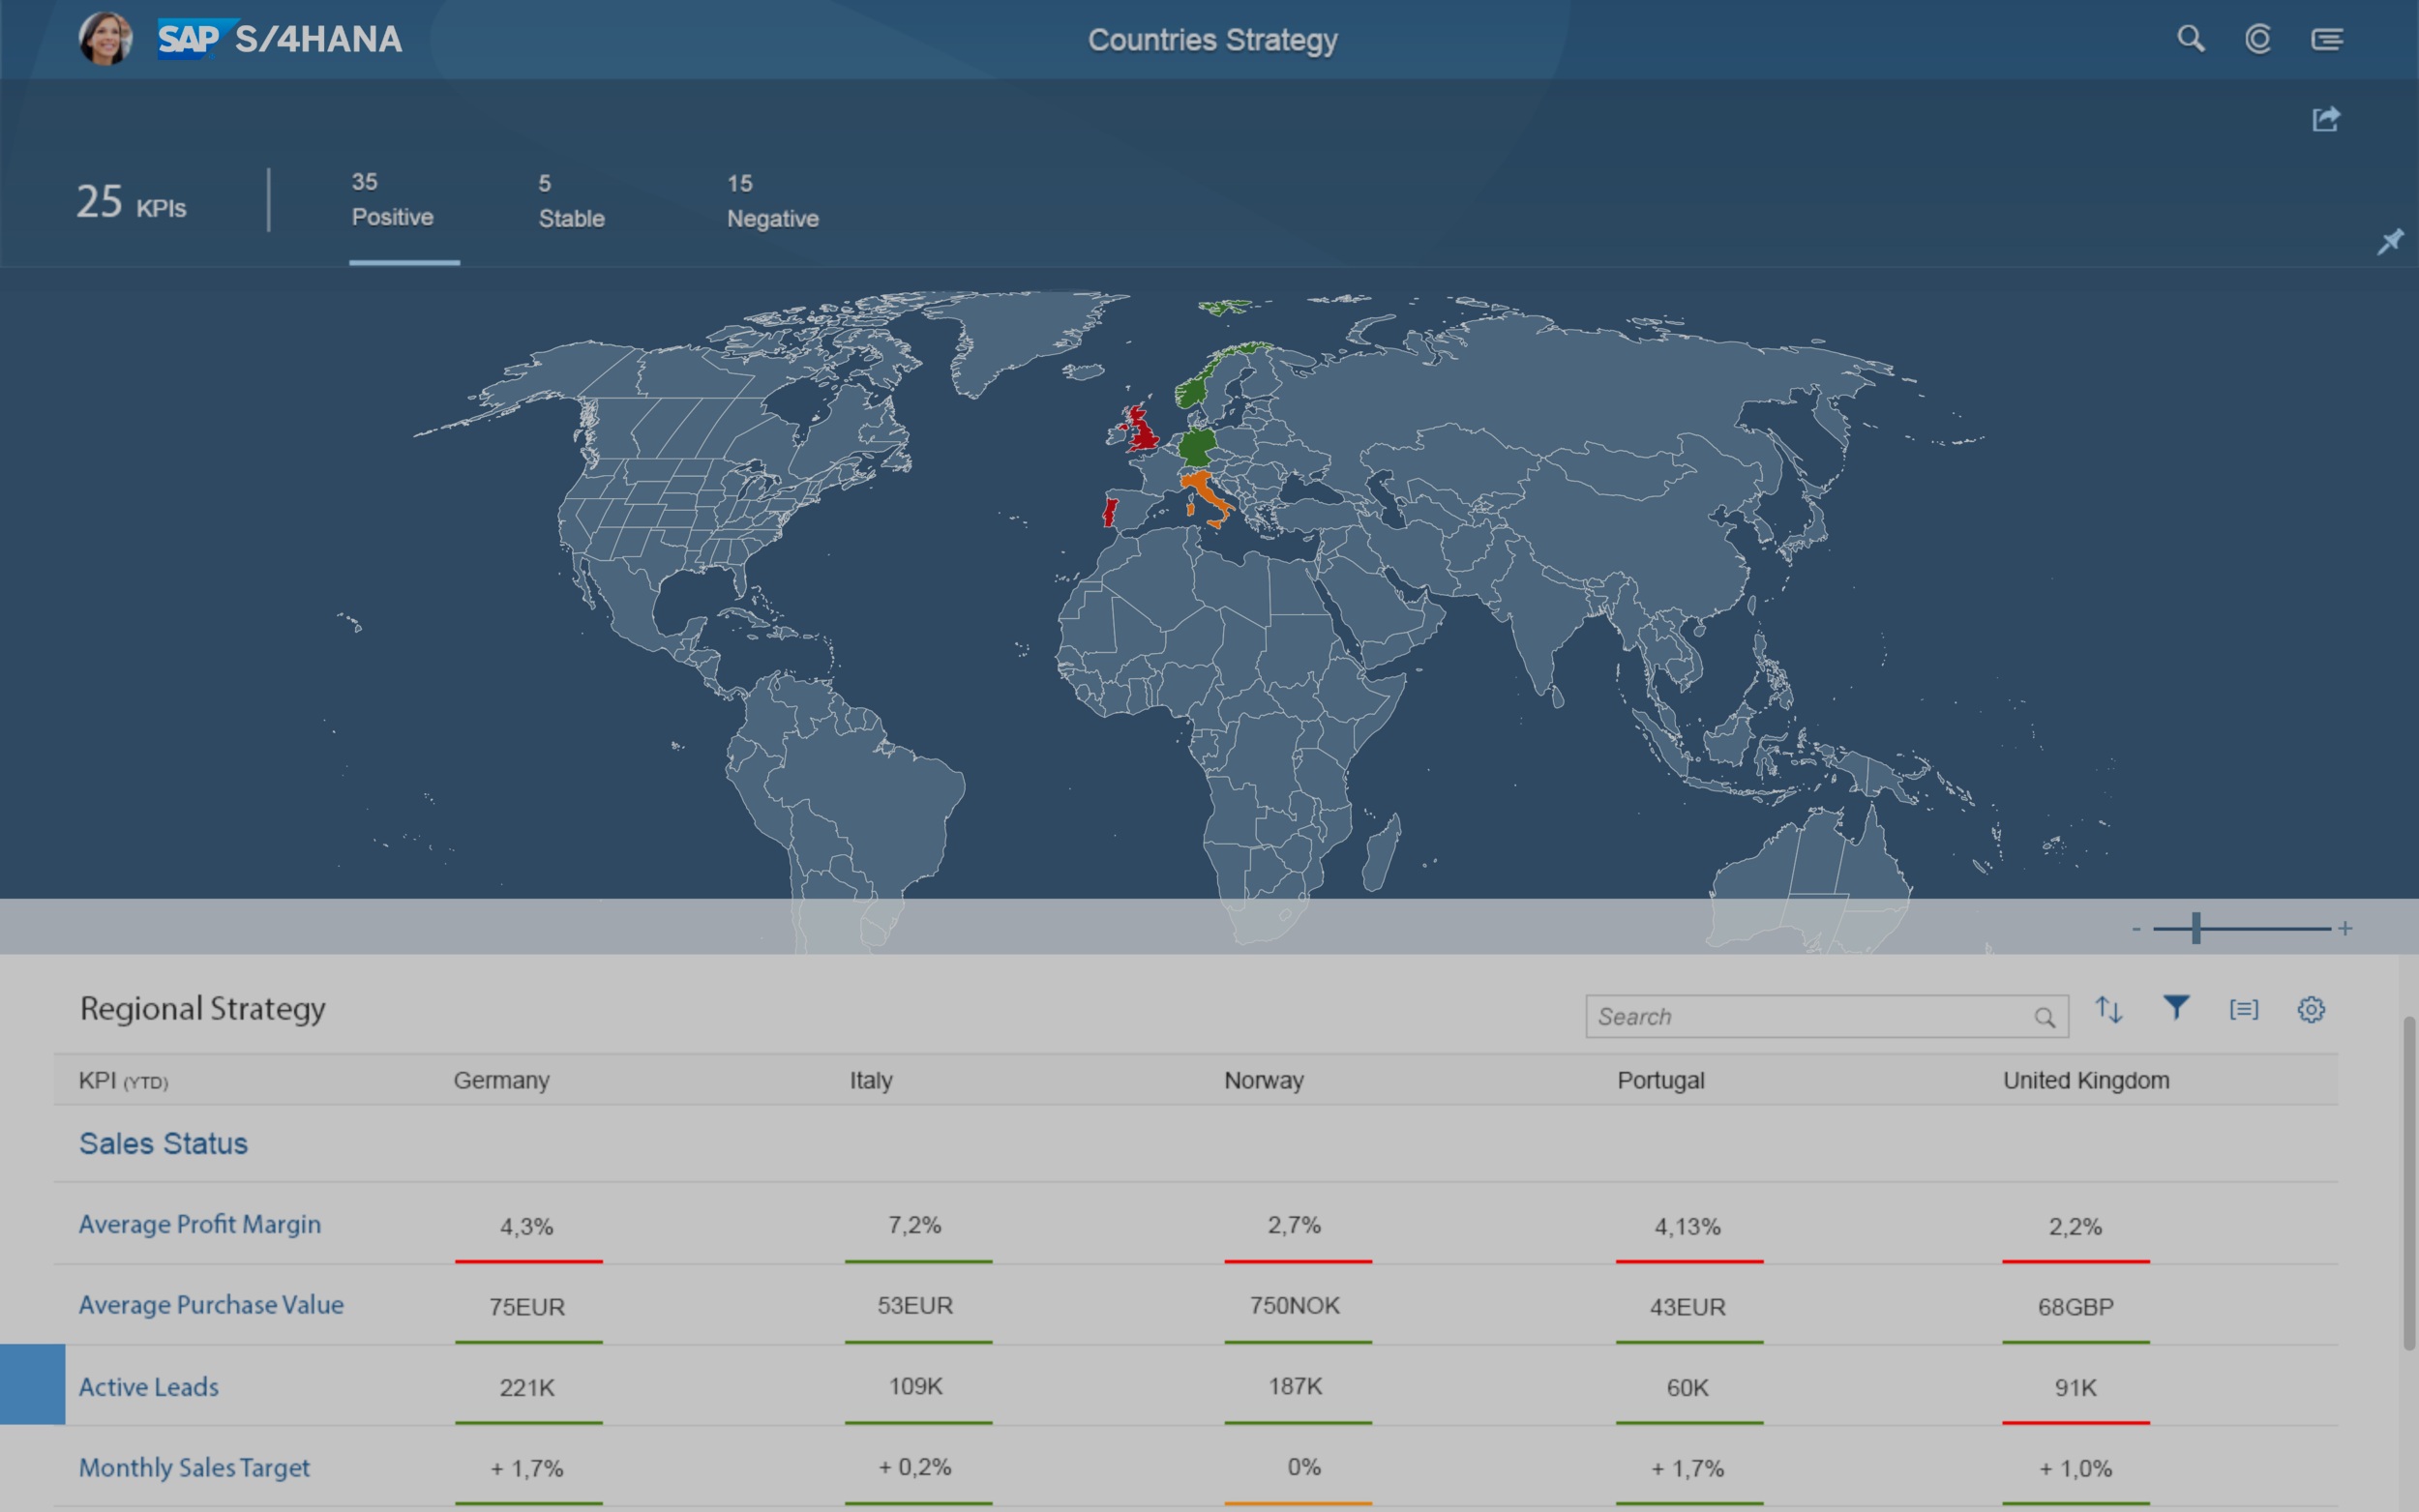
SAP Strategy Management
Research and concept
Scope
I was invited to assist Christian (product owner) on the project SAP Strategy Management, as my first project when joining SAP. We had the opportunity to explore and understand the pain points of existing tools and promote a proof of concept that:
provided easy to use dashboard to monitor users configured KPIs
allows forecasting and benchmarking KPIs;
could provide strategic insights with live-data (among diverse data sources),
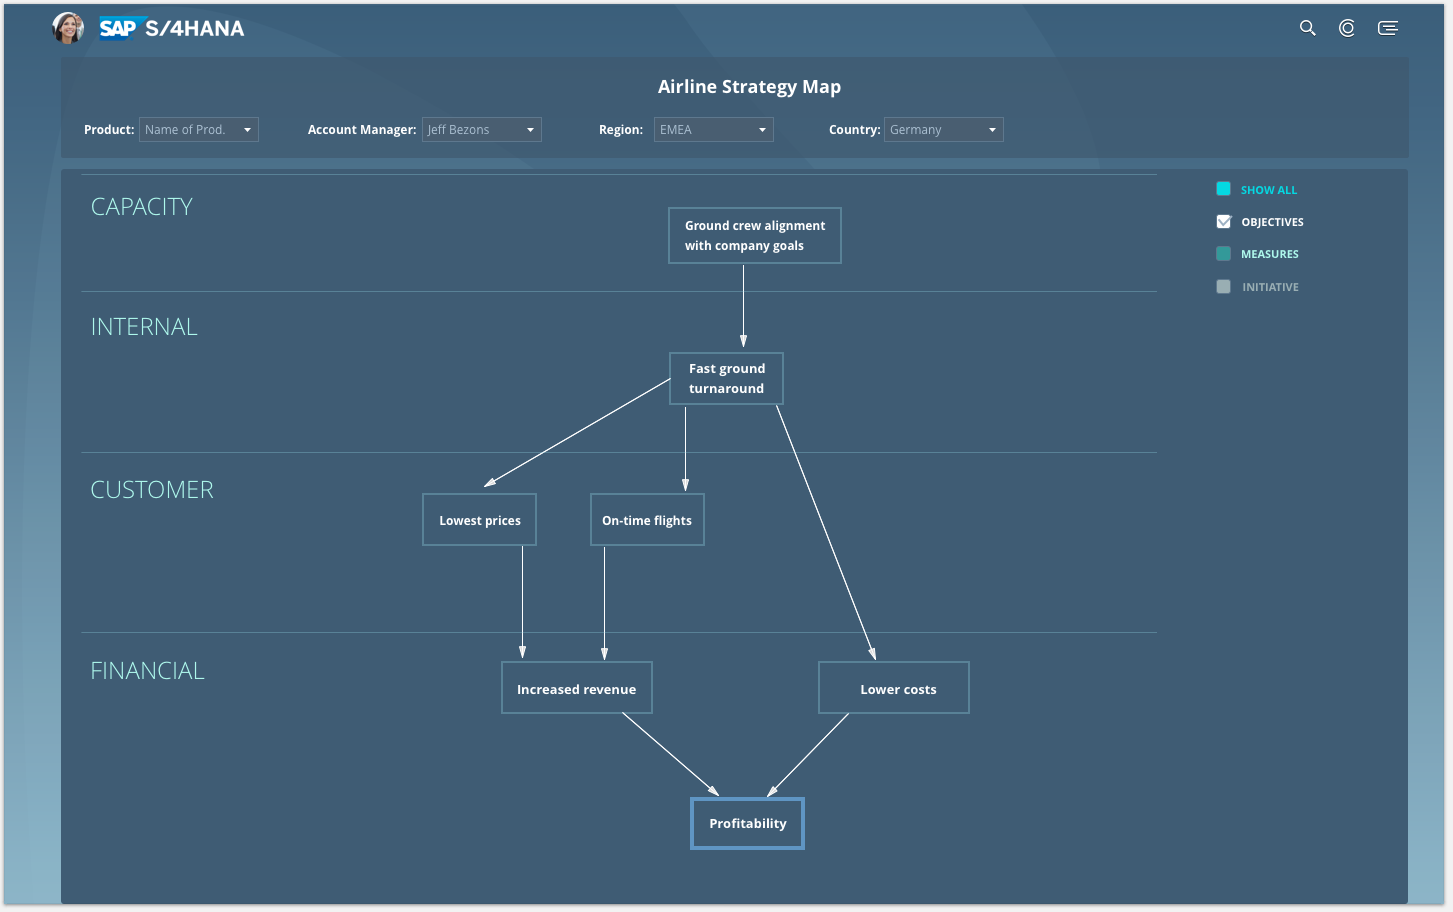
provides visualisations as correlations via causal and strategic maps,
helps users to communicate further their strategy to their stakeholders.

My contribution as Senior Experience Designer:
Observe interviews with experts and take notes;
Synthesise data from interviews;
Debate AS-IS process with product owner;
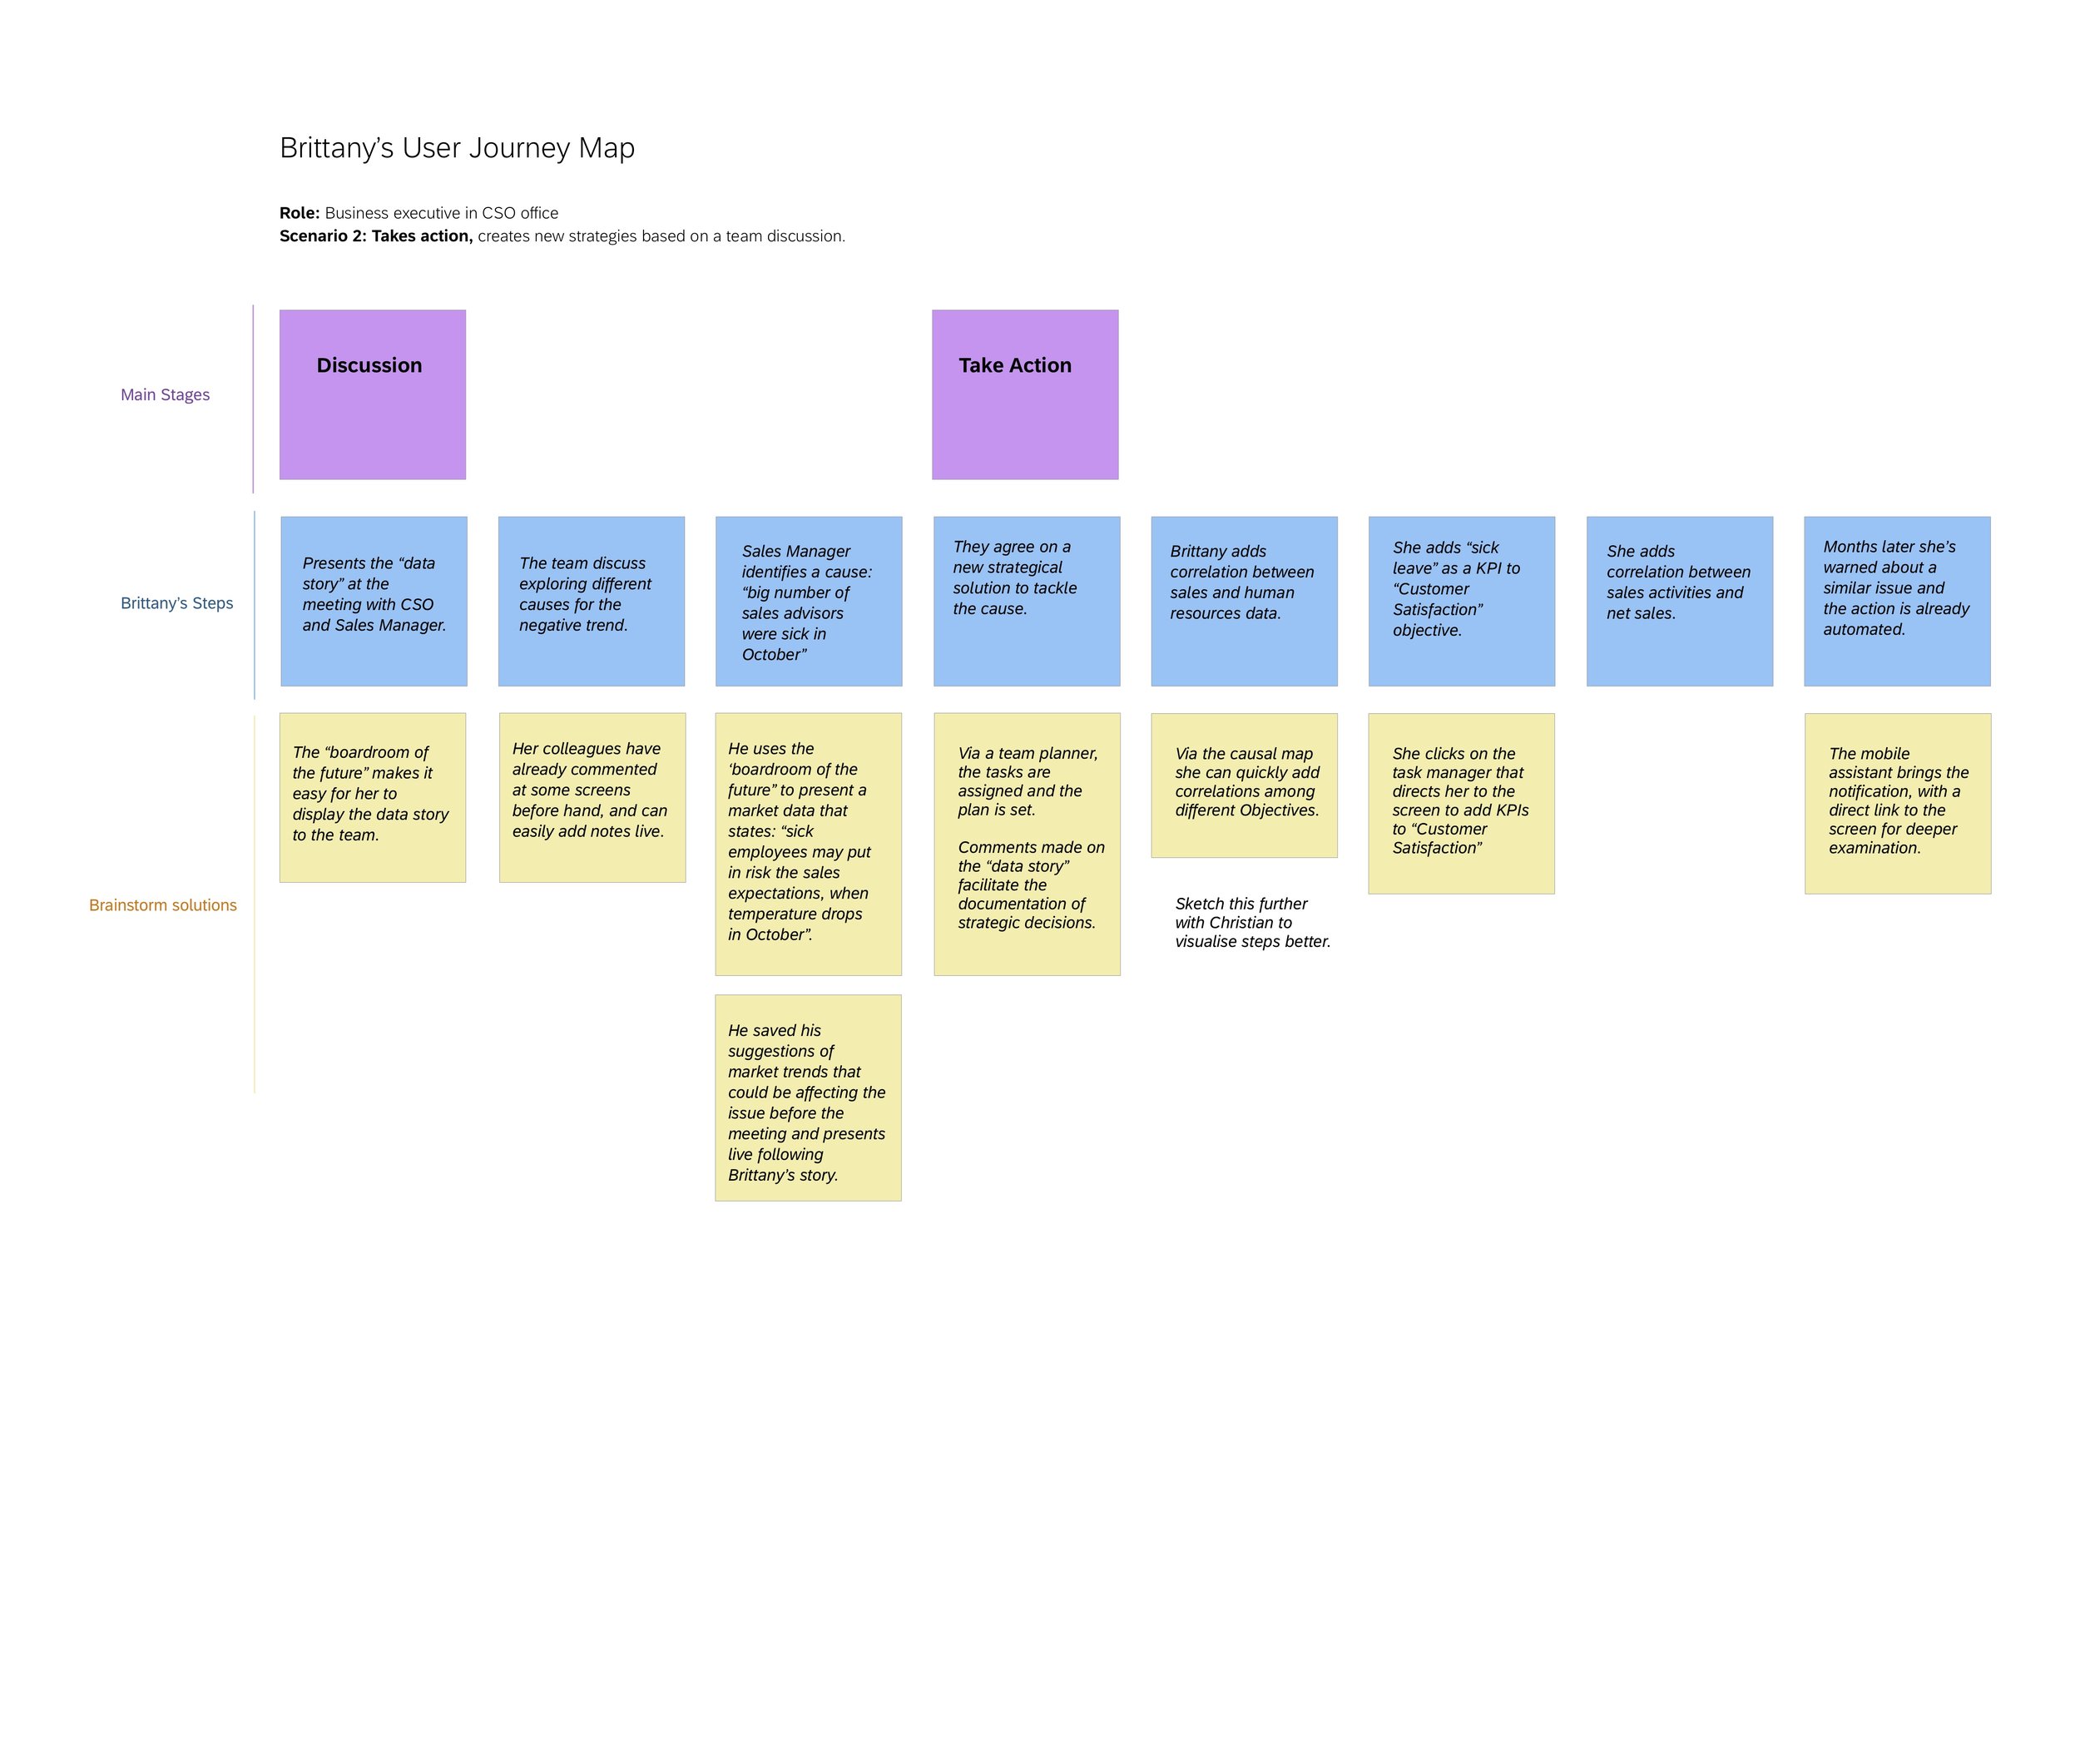
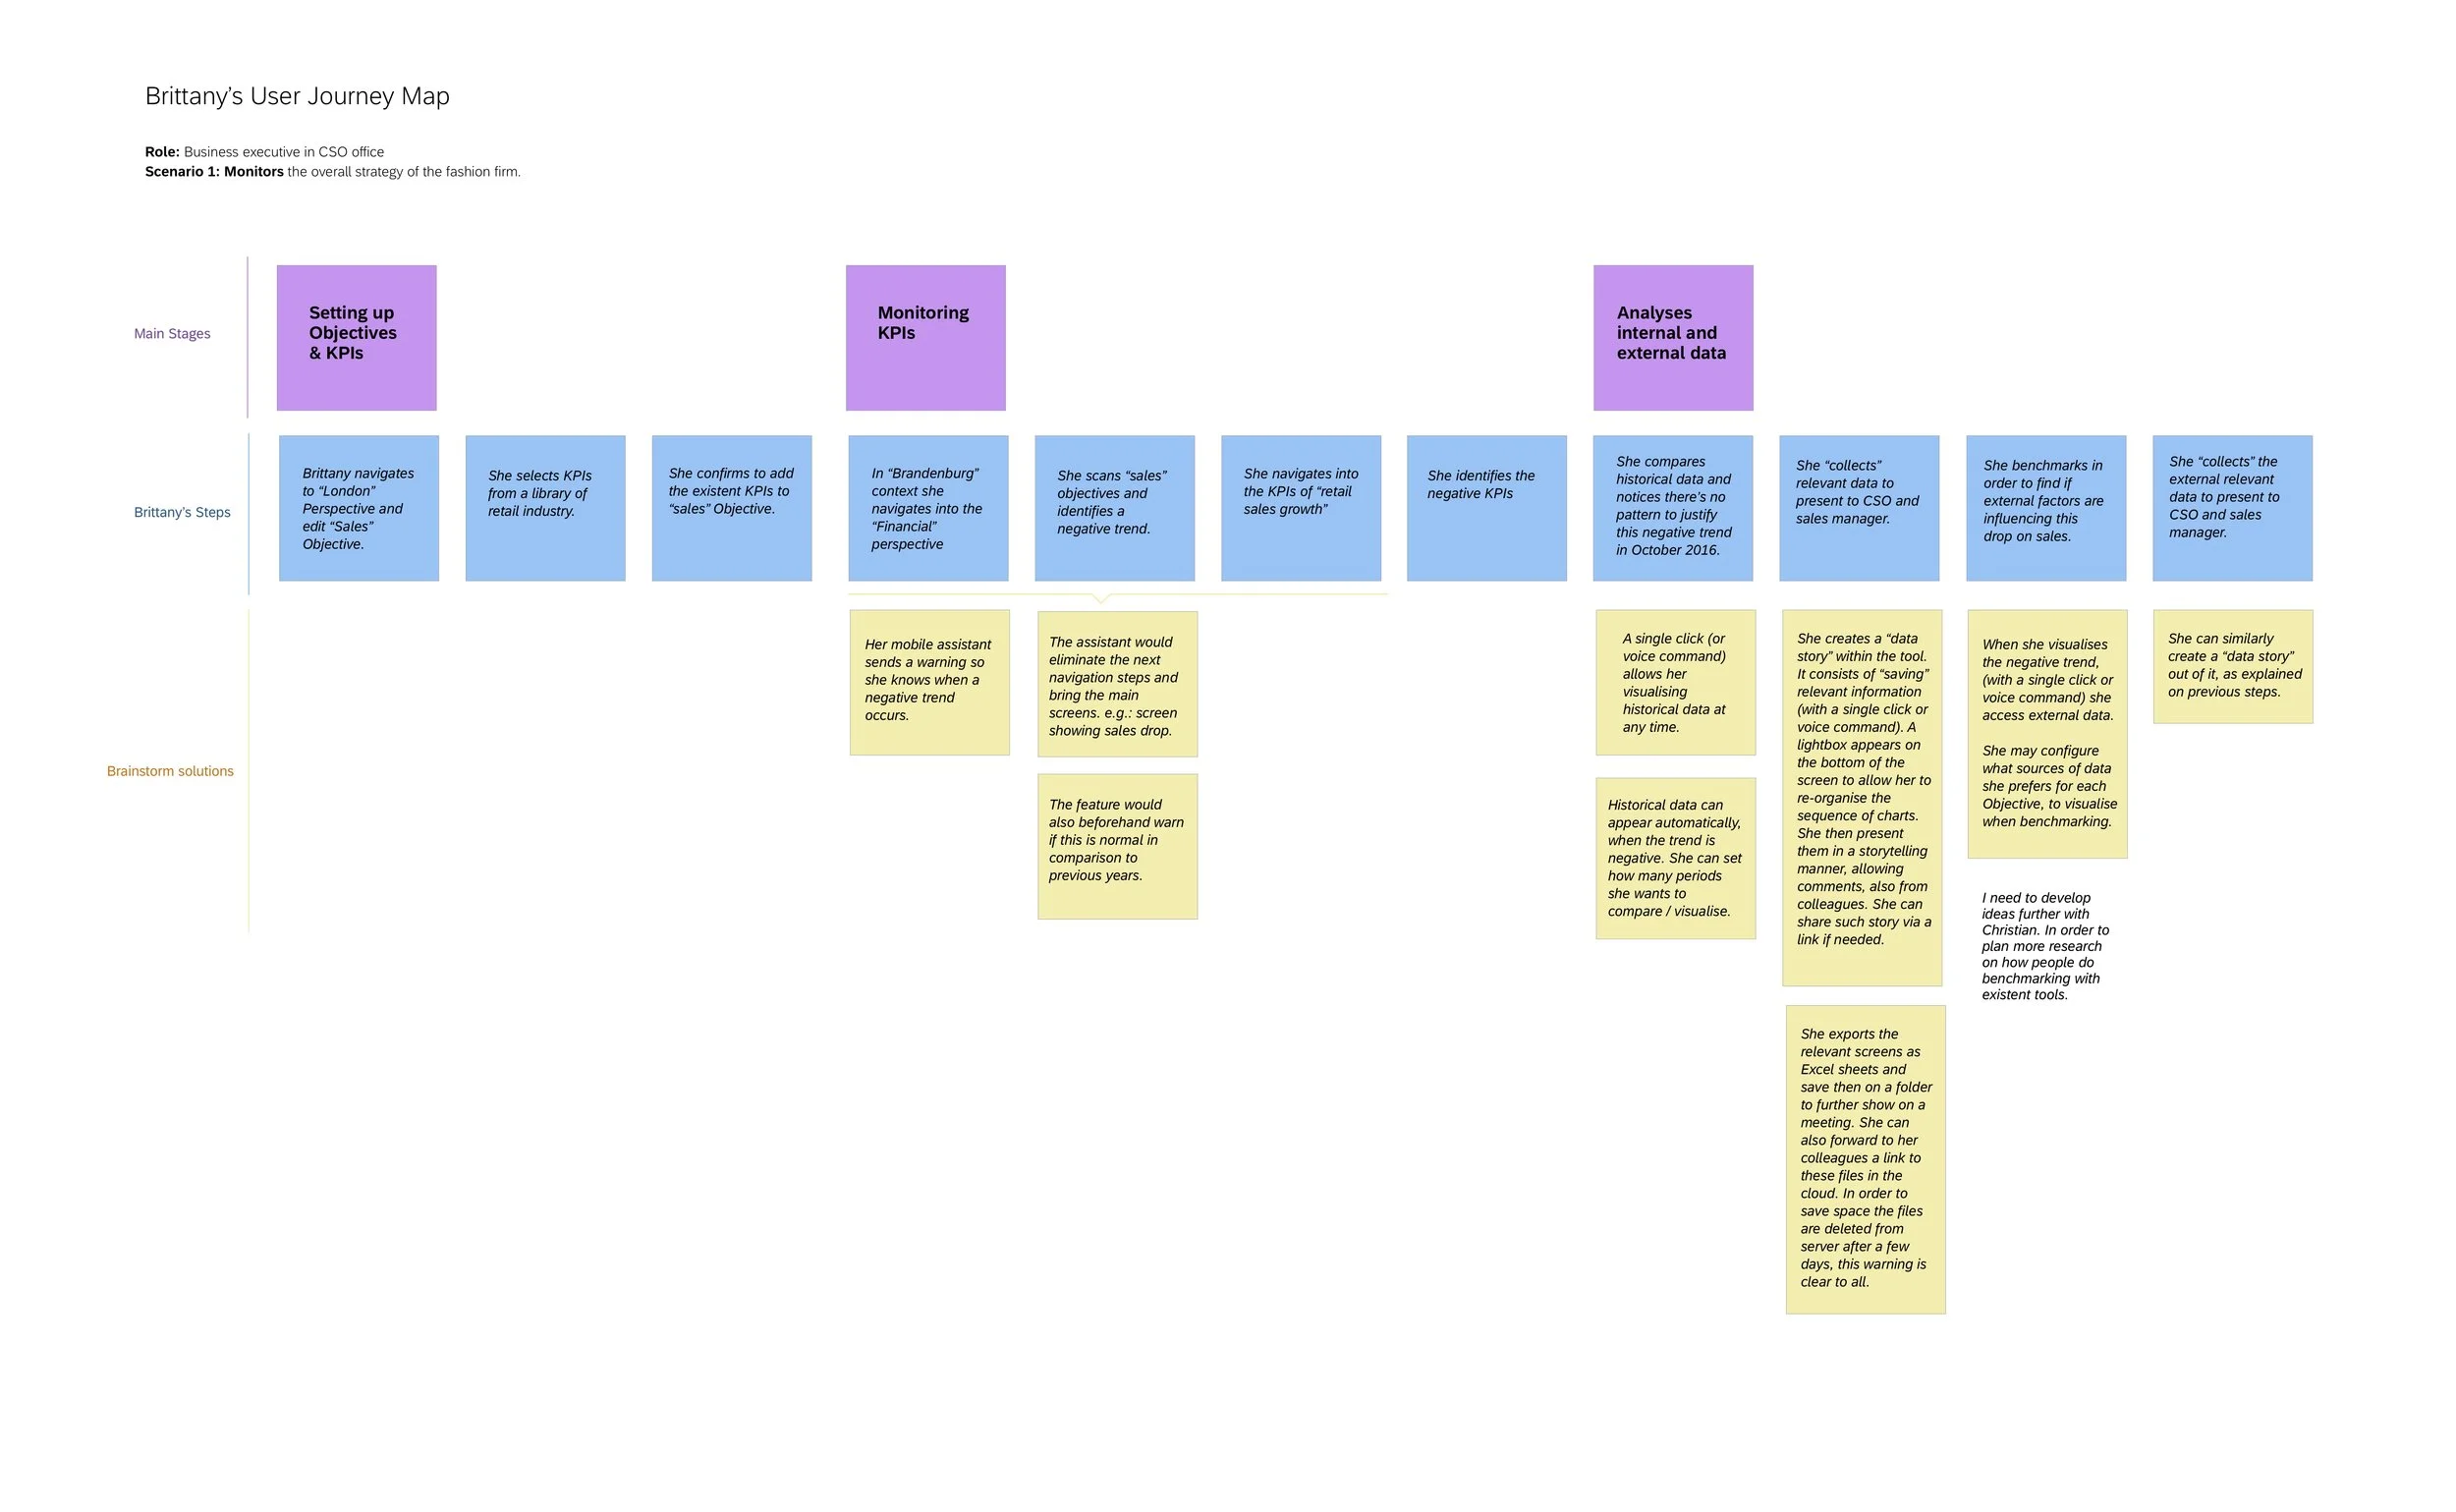
Create user journey maps (along with product owner);
Design interactive high-fidelity static prototypes;
Contributions on visual design on the hi-fi prototype;
1. Strategy
Business Objective: deliver an easy to use, utilising the fresh look of FIORI 2.0, solving pain points of strategy management in the cloud. Providing insights to users via real-time data, KPIs, causal maps and strategic maps.
Target Audience: CEO, C-level, Strategy Manager or Senior Manager of a mid-sized or big corporation with need to define, monitor, execute, benchmark and communicate strategic goals with the help of useful KPIs.
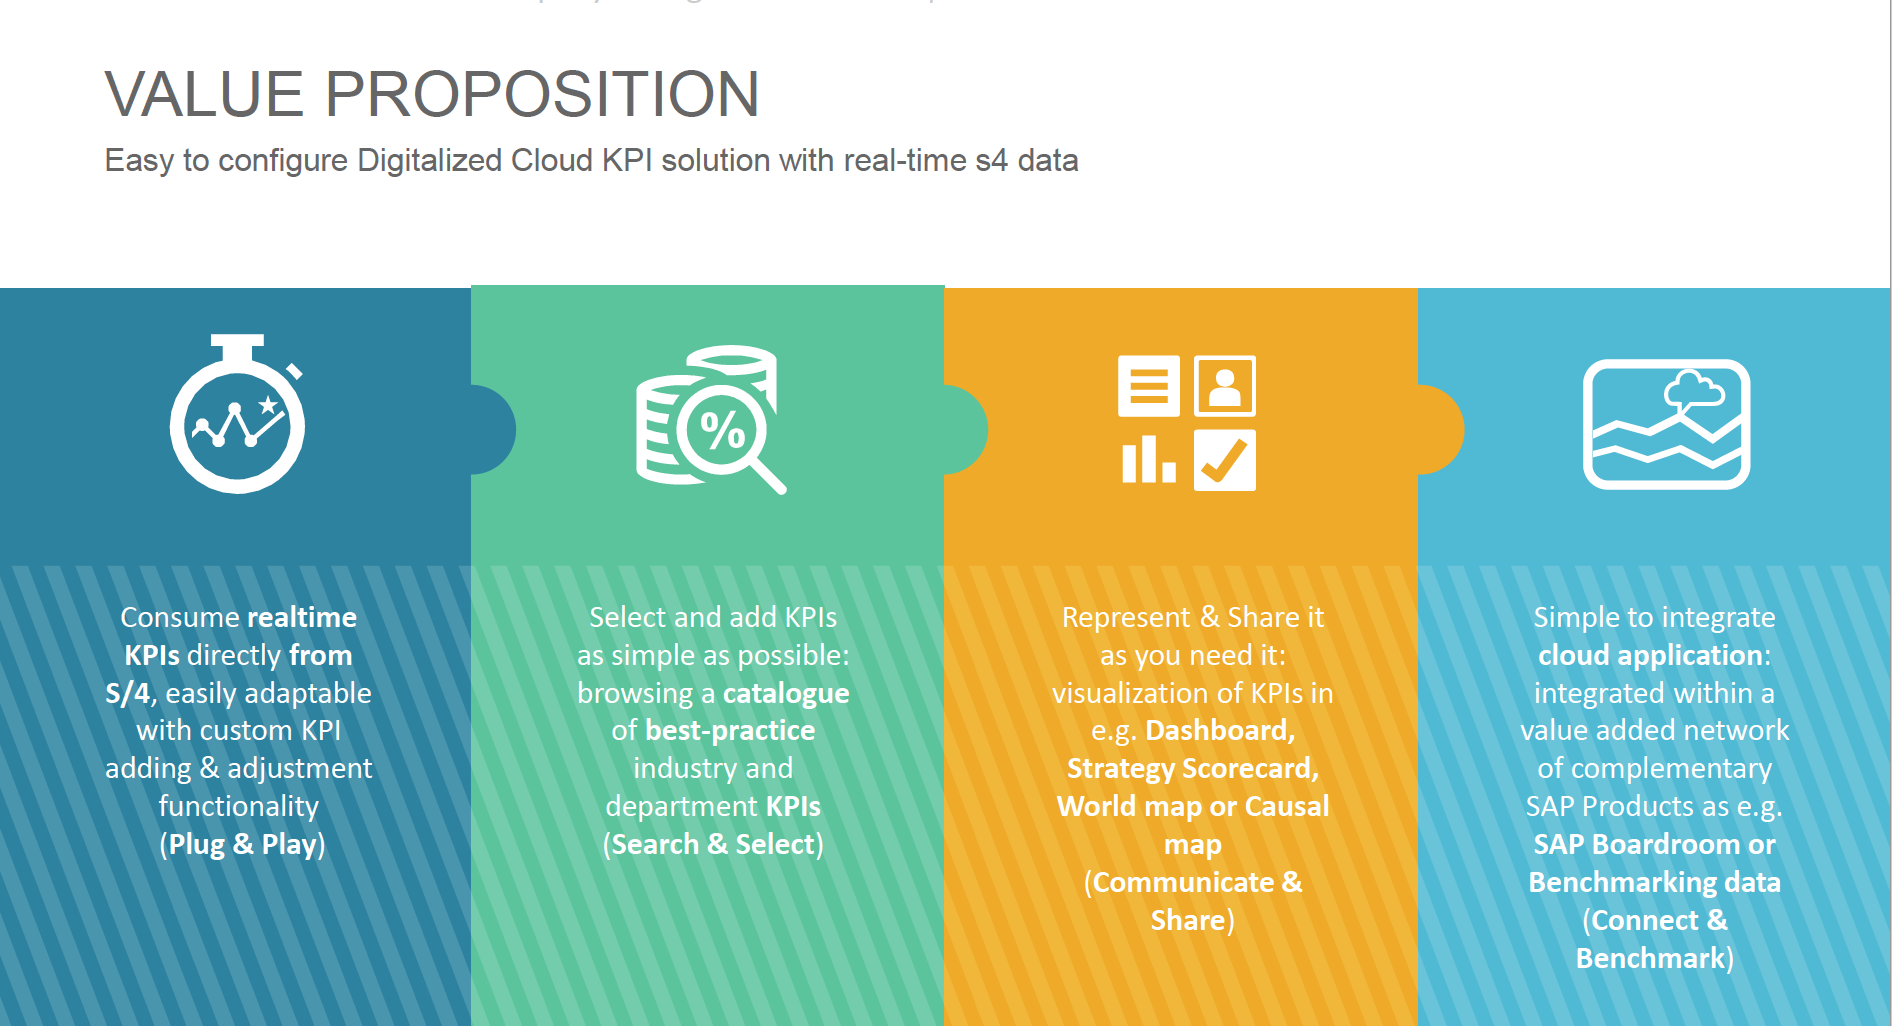
Differentiators: our solution aim to innovate the way users visualize their key metrics, on fast-paced environments. Making use of live-data, and pre-defined calculations, users may rely on non-conflicting figures, when reporting and making informed decisions on their strategy departments.
2. User Needs
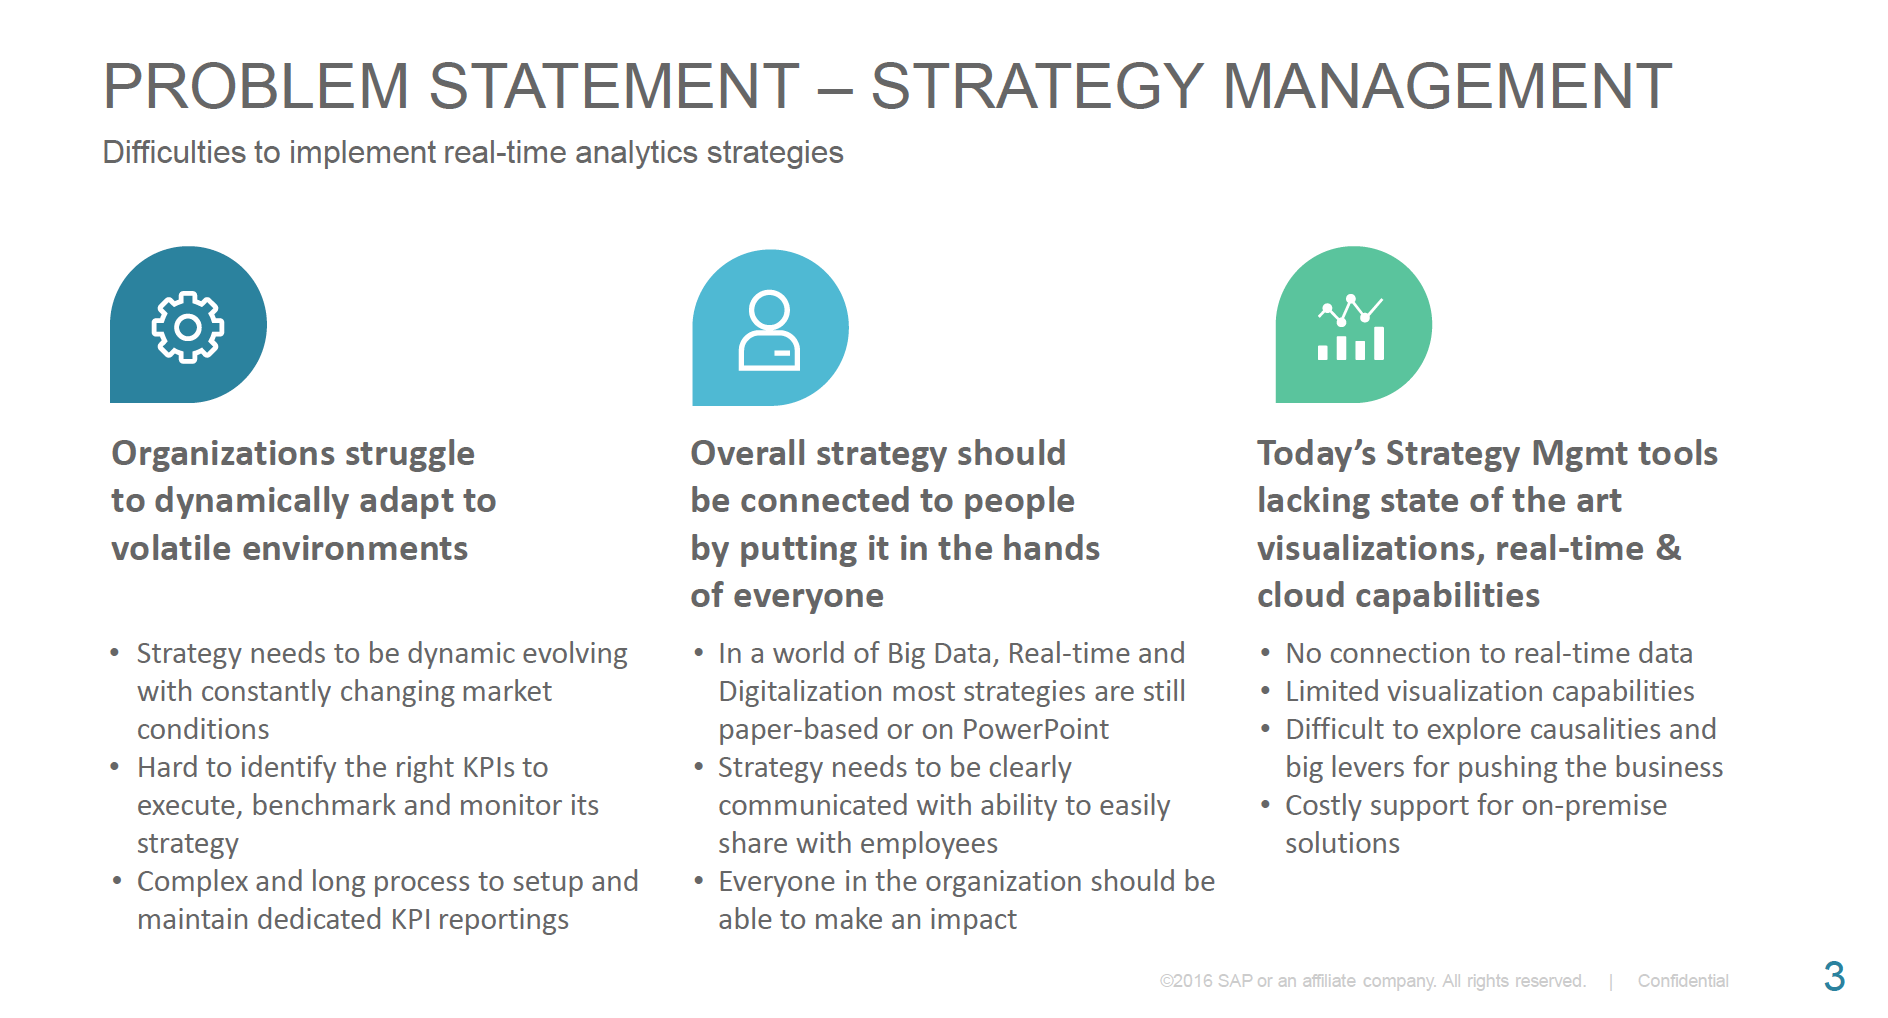
Motivation: commit better informed decisions on a faster pace. Communicate strategy to stakeholders with the help of live data and dashboards, easily shareable and visually appealing versus old ways of doing same tasks.
Pain Points: too many tasks and time is limited. Tools are not integrated, which makes user check different sources of data, needing to generate several reports monthly or quarterly, not often uses access live or real data.
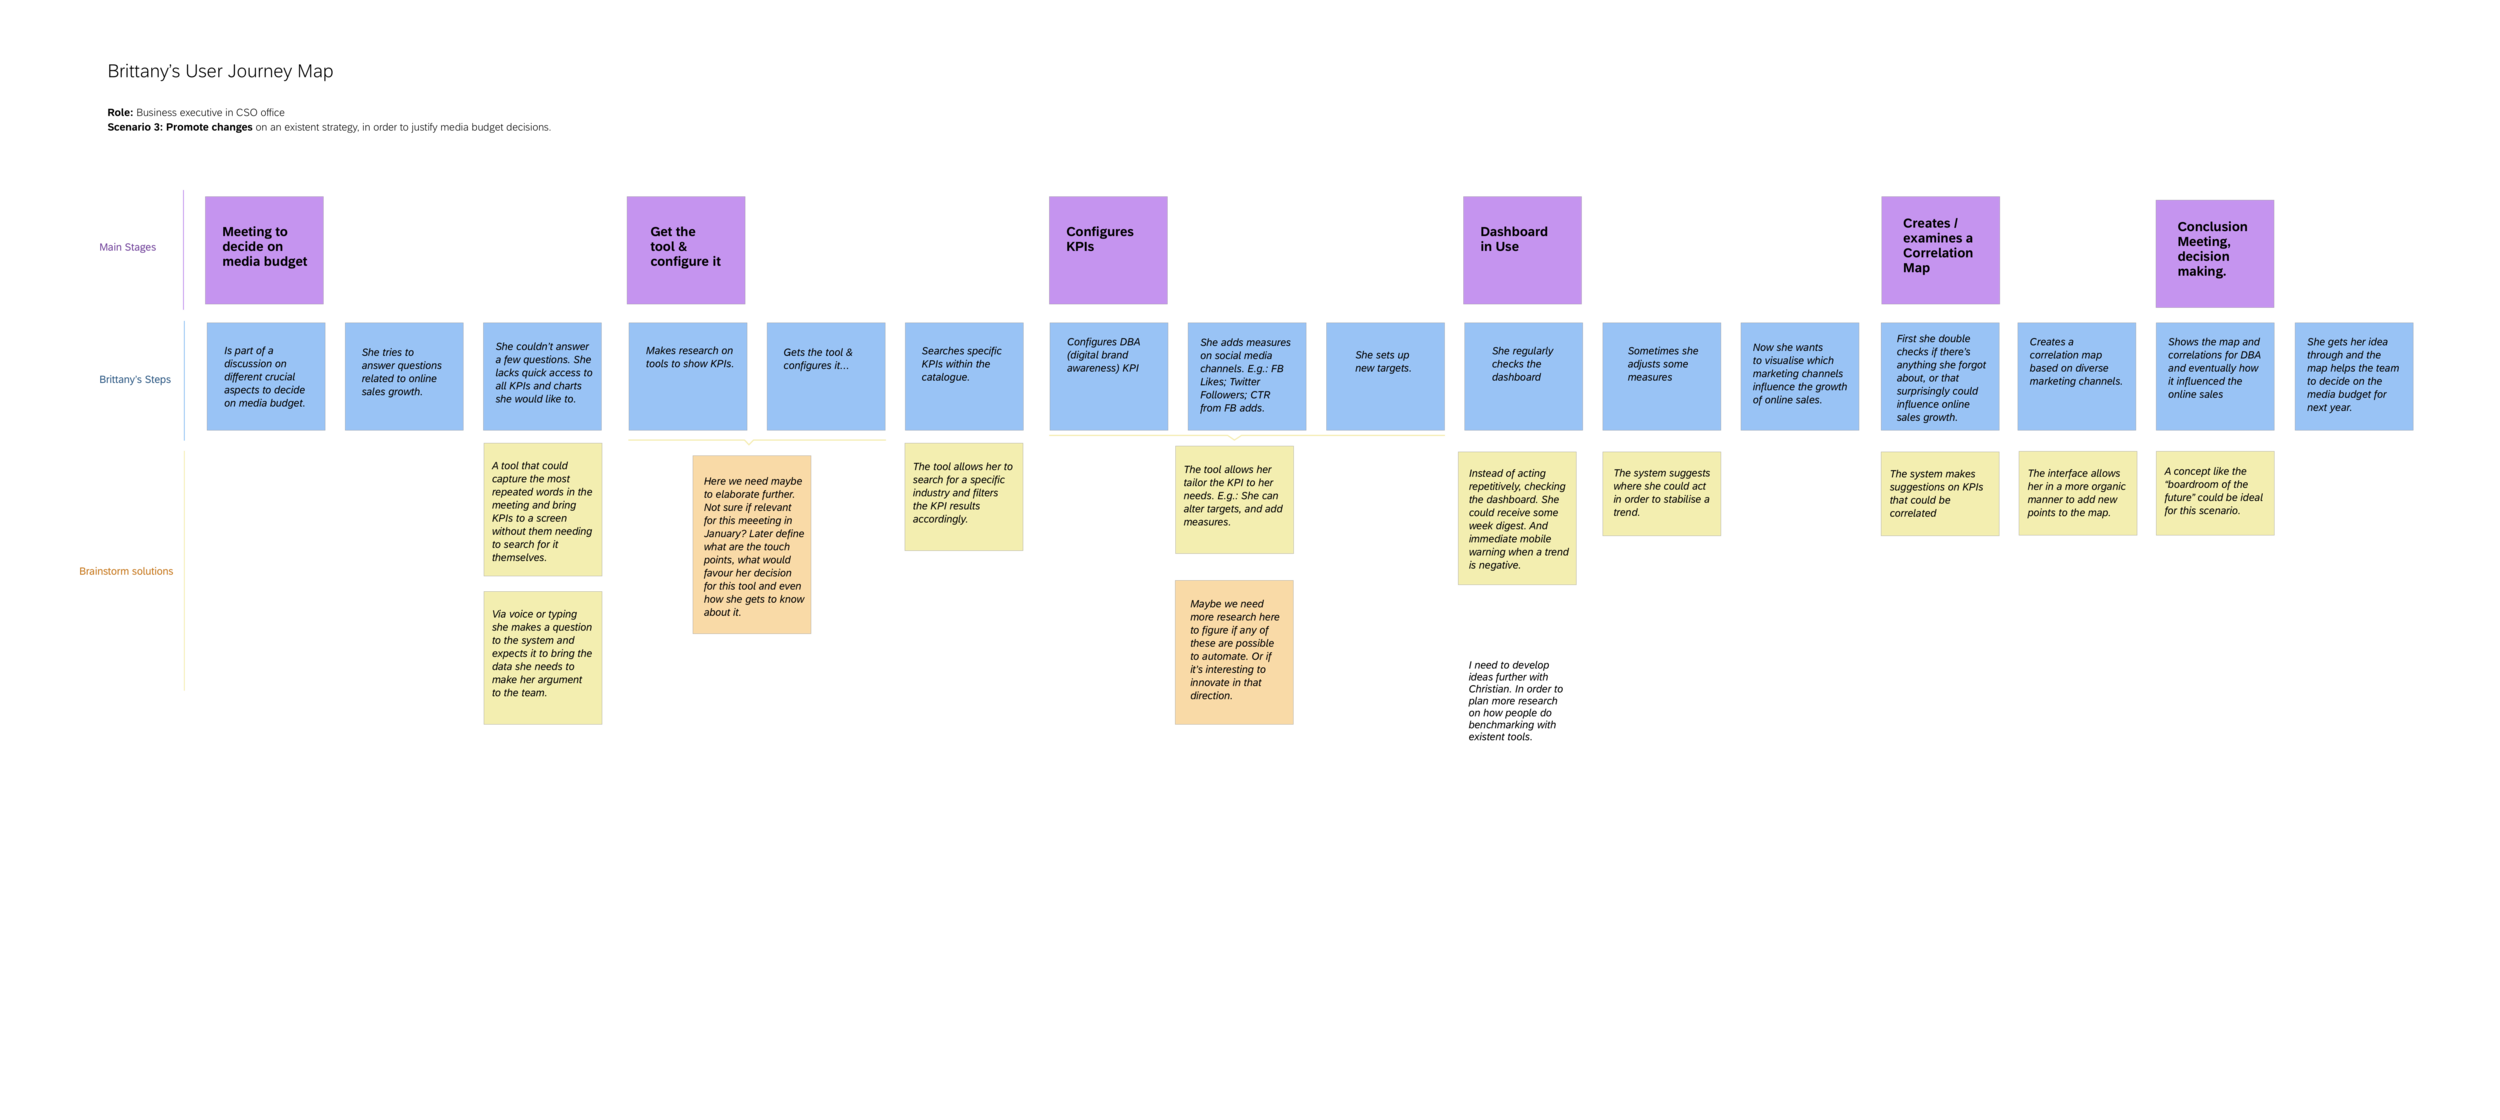
User Journey Maps:
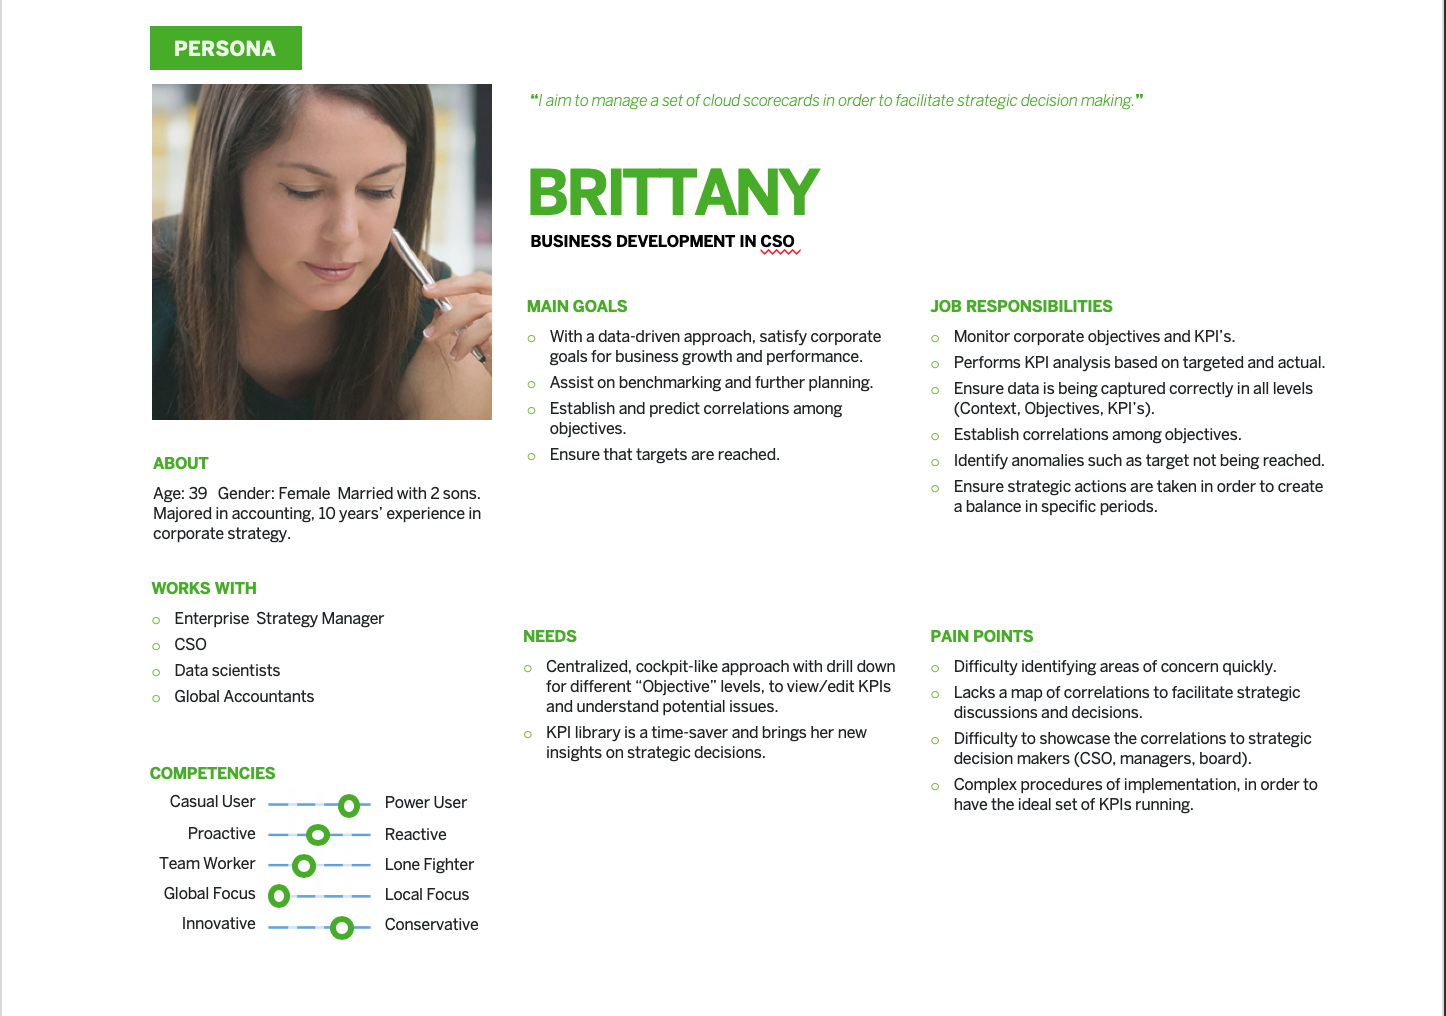
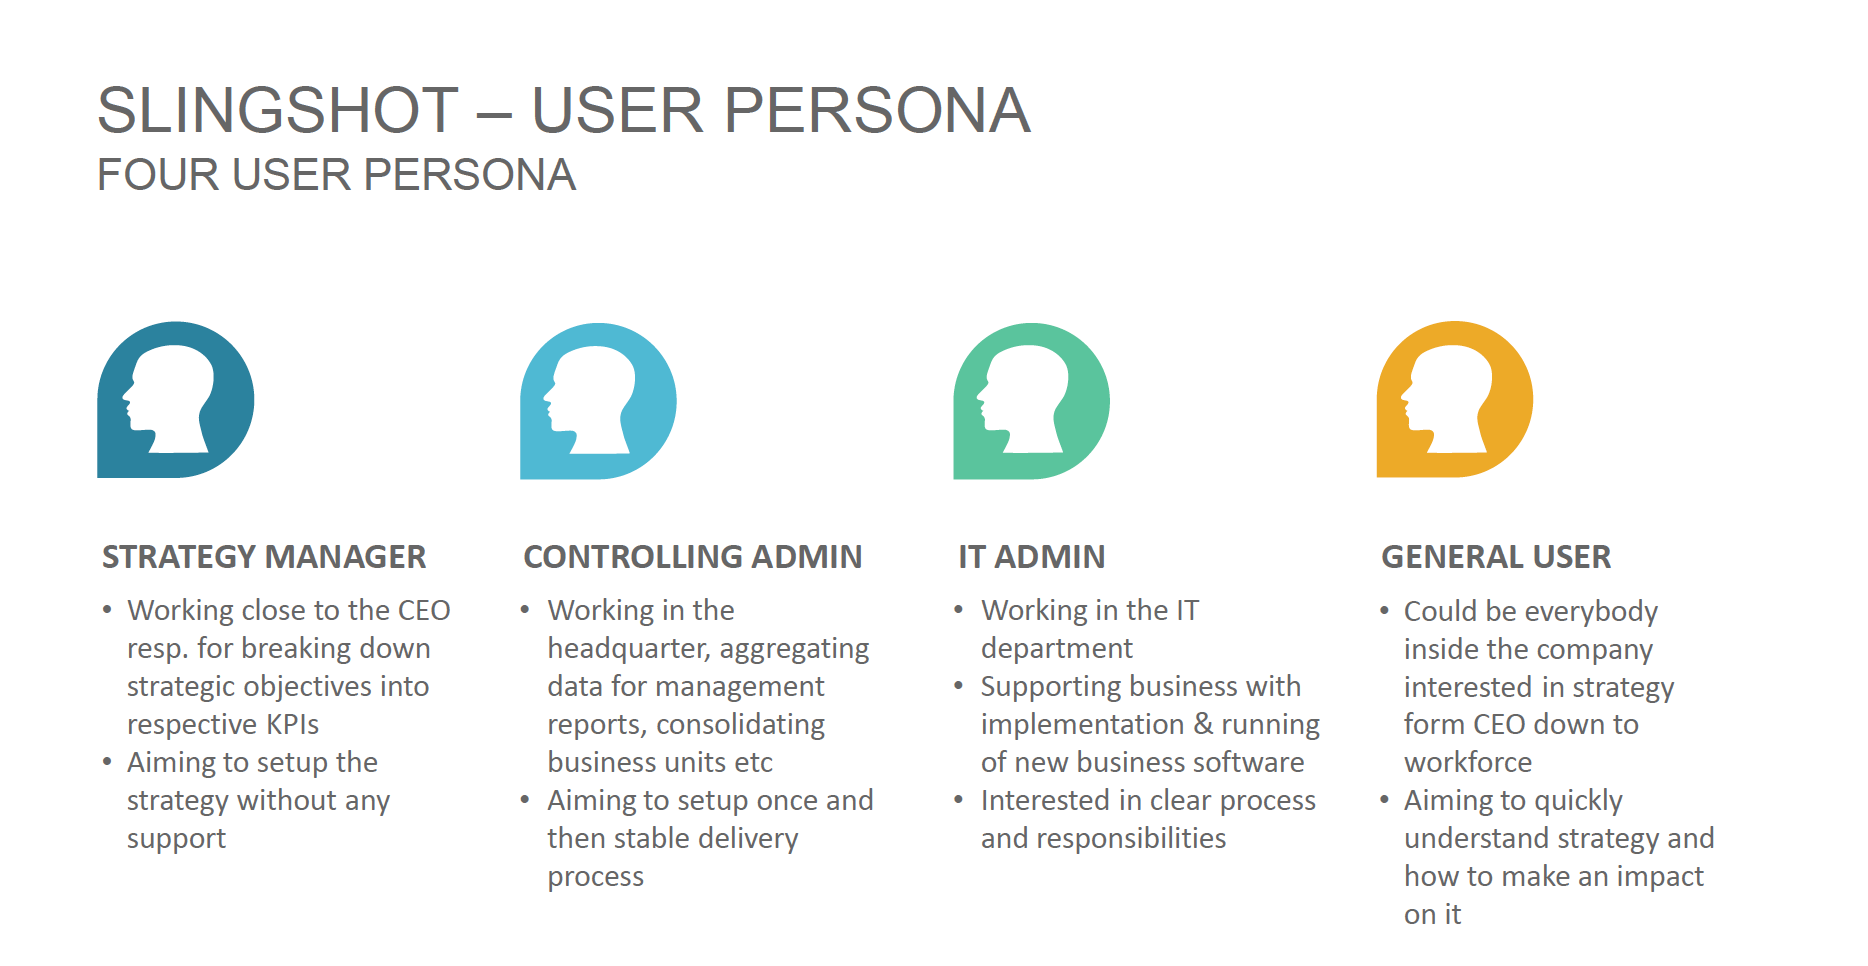
Personas
3. Solution
Functionality: The financial performance and KPI management solution enhances the way users measure and communicate their company strategy. Mostly because they commit decisions based on live-data, they will avoid mistaken or overlapping figures.
Media and Context: Desktop for most of the analysis, where complex data and drill downs are needed. A dashboard with KPIs configured by users, causal maps and strategic maps will be the core of data visualization within this tool.
Rewards: Ease of use and effective data visualisation results in a better informed and faster decision making process.
4. Visual Design
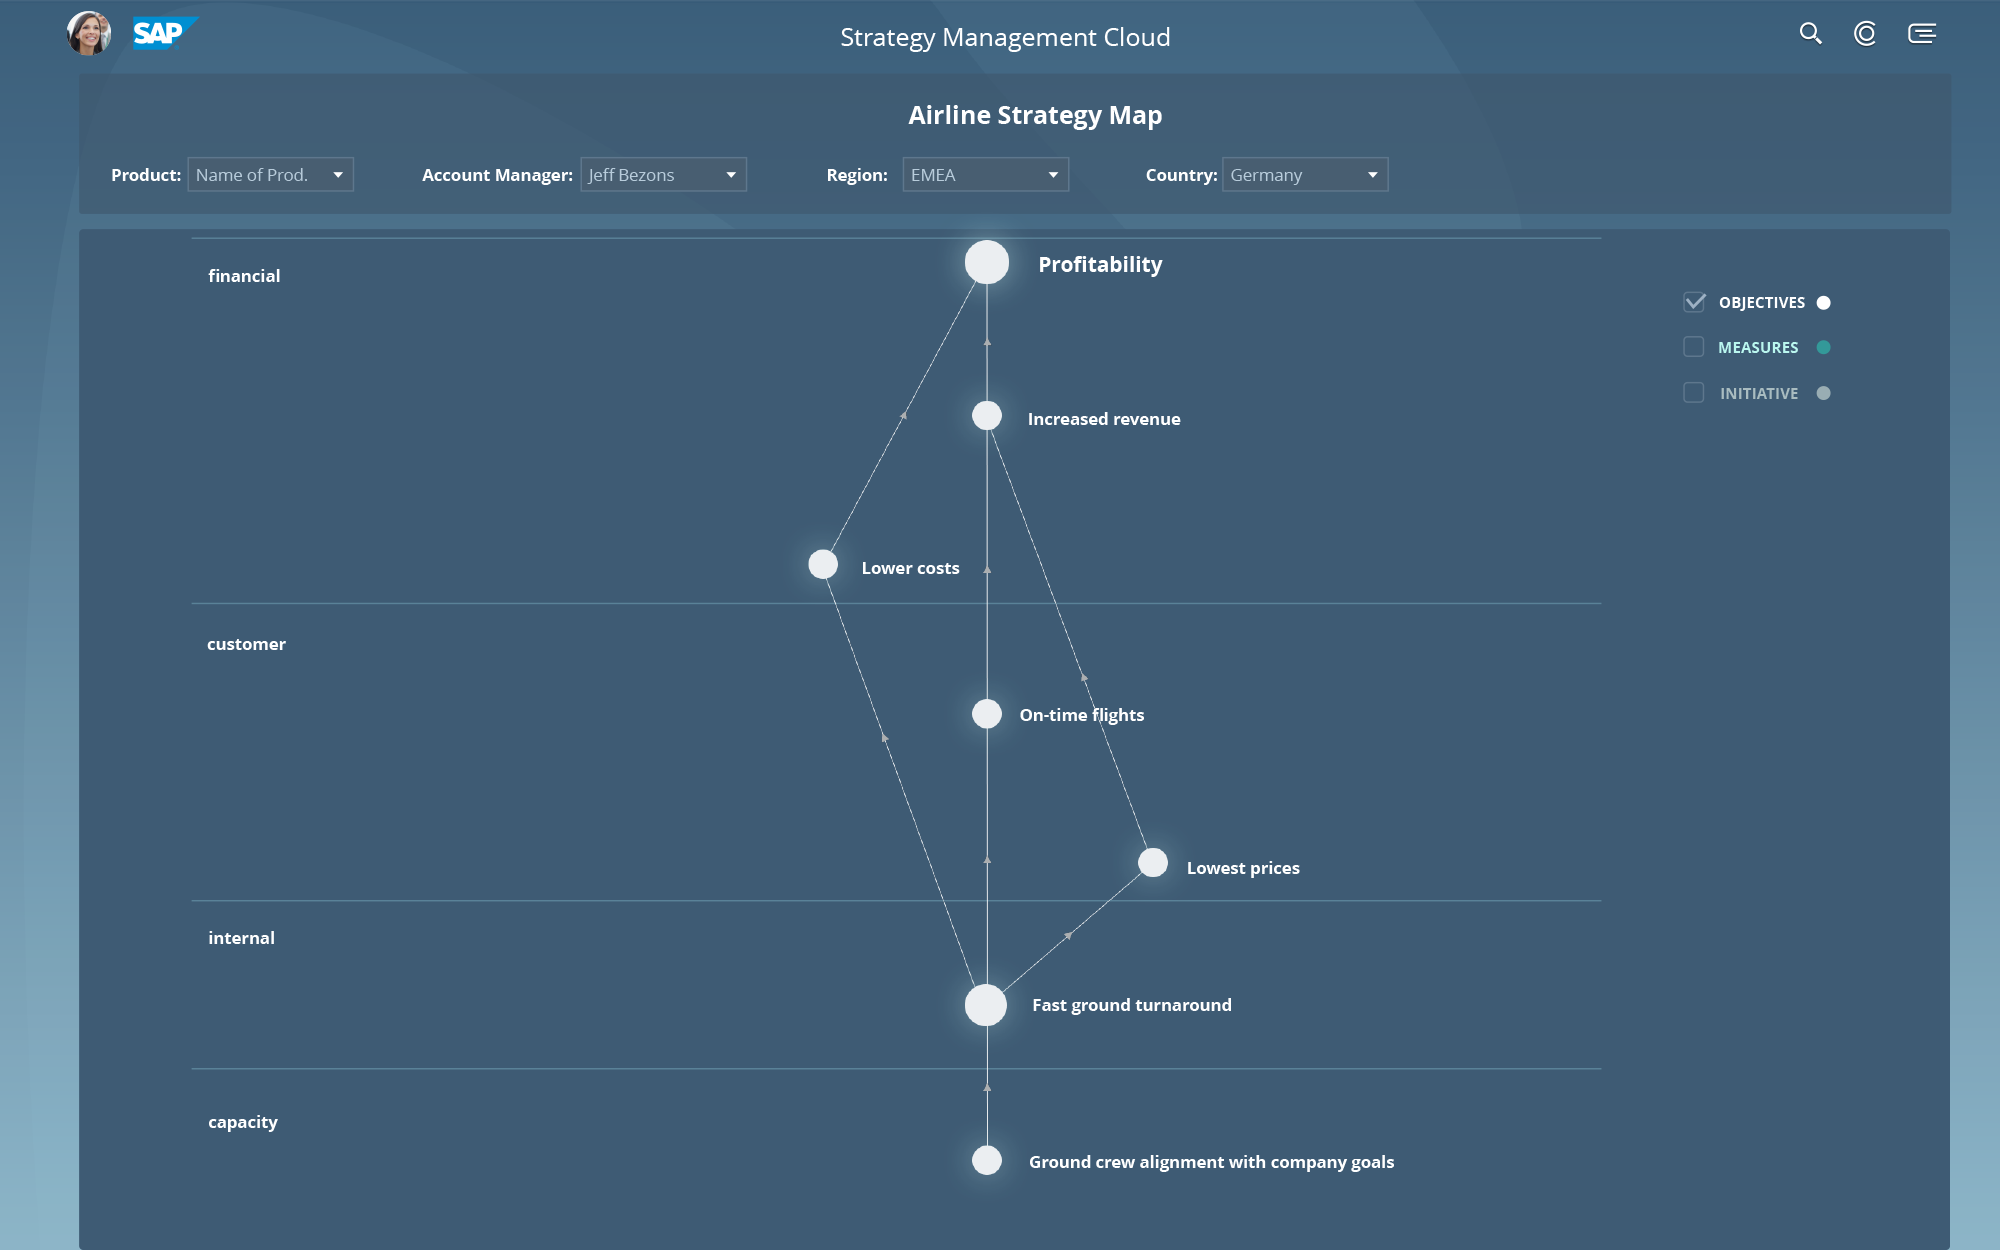
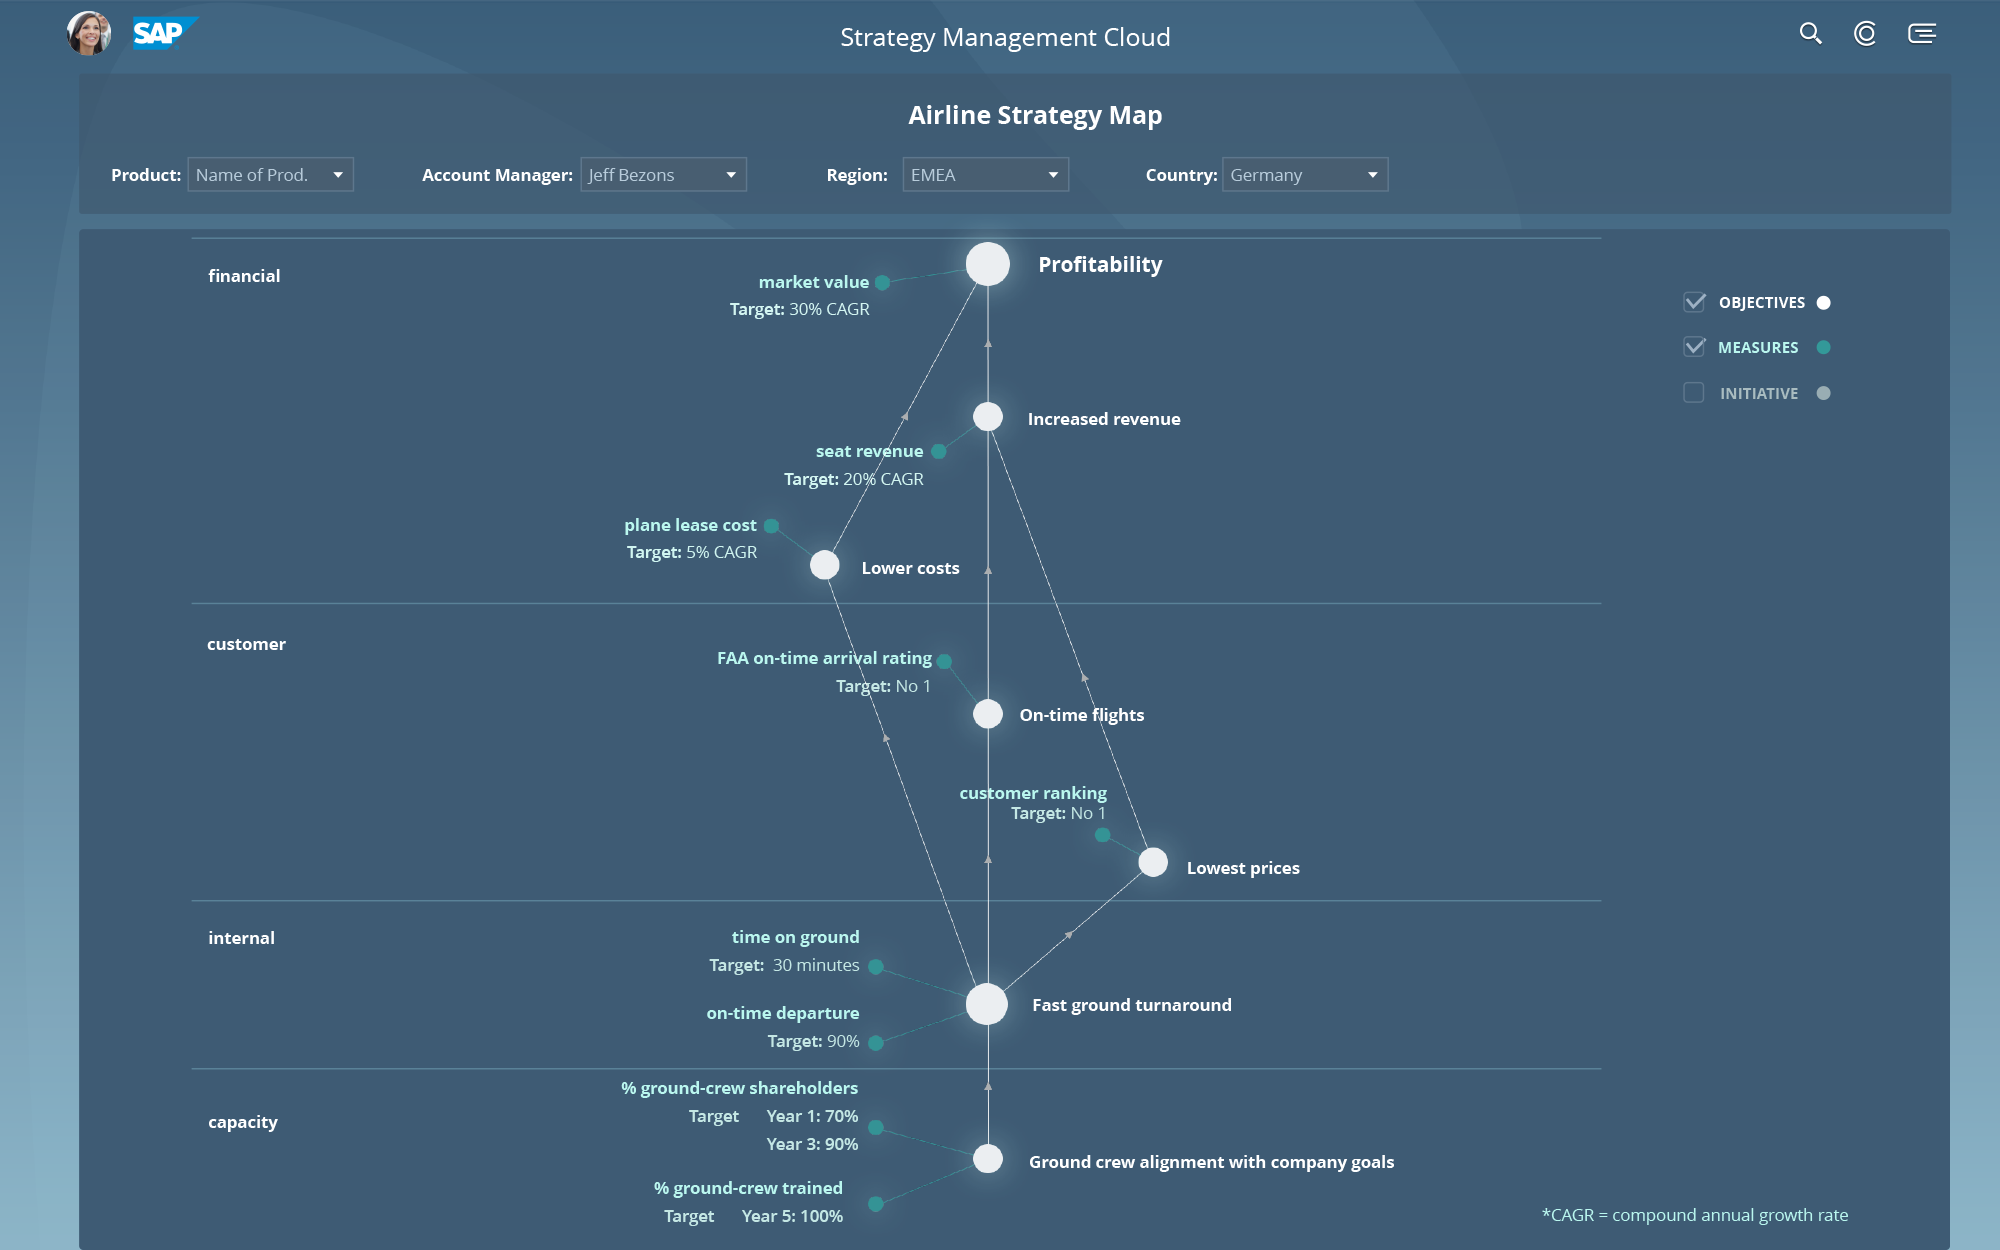
I worked on visual design with the goal to enhance the users easy to report and to consume data visualisation in our tool.
5. High Fidelity Prototype
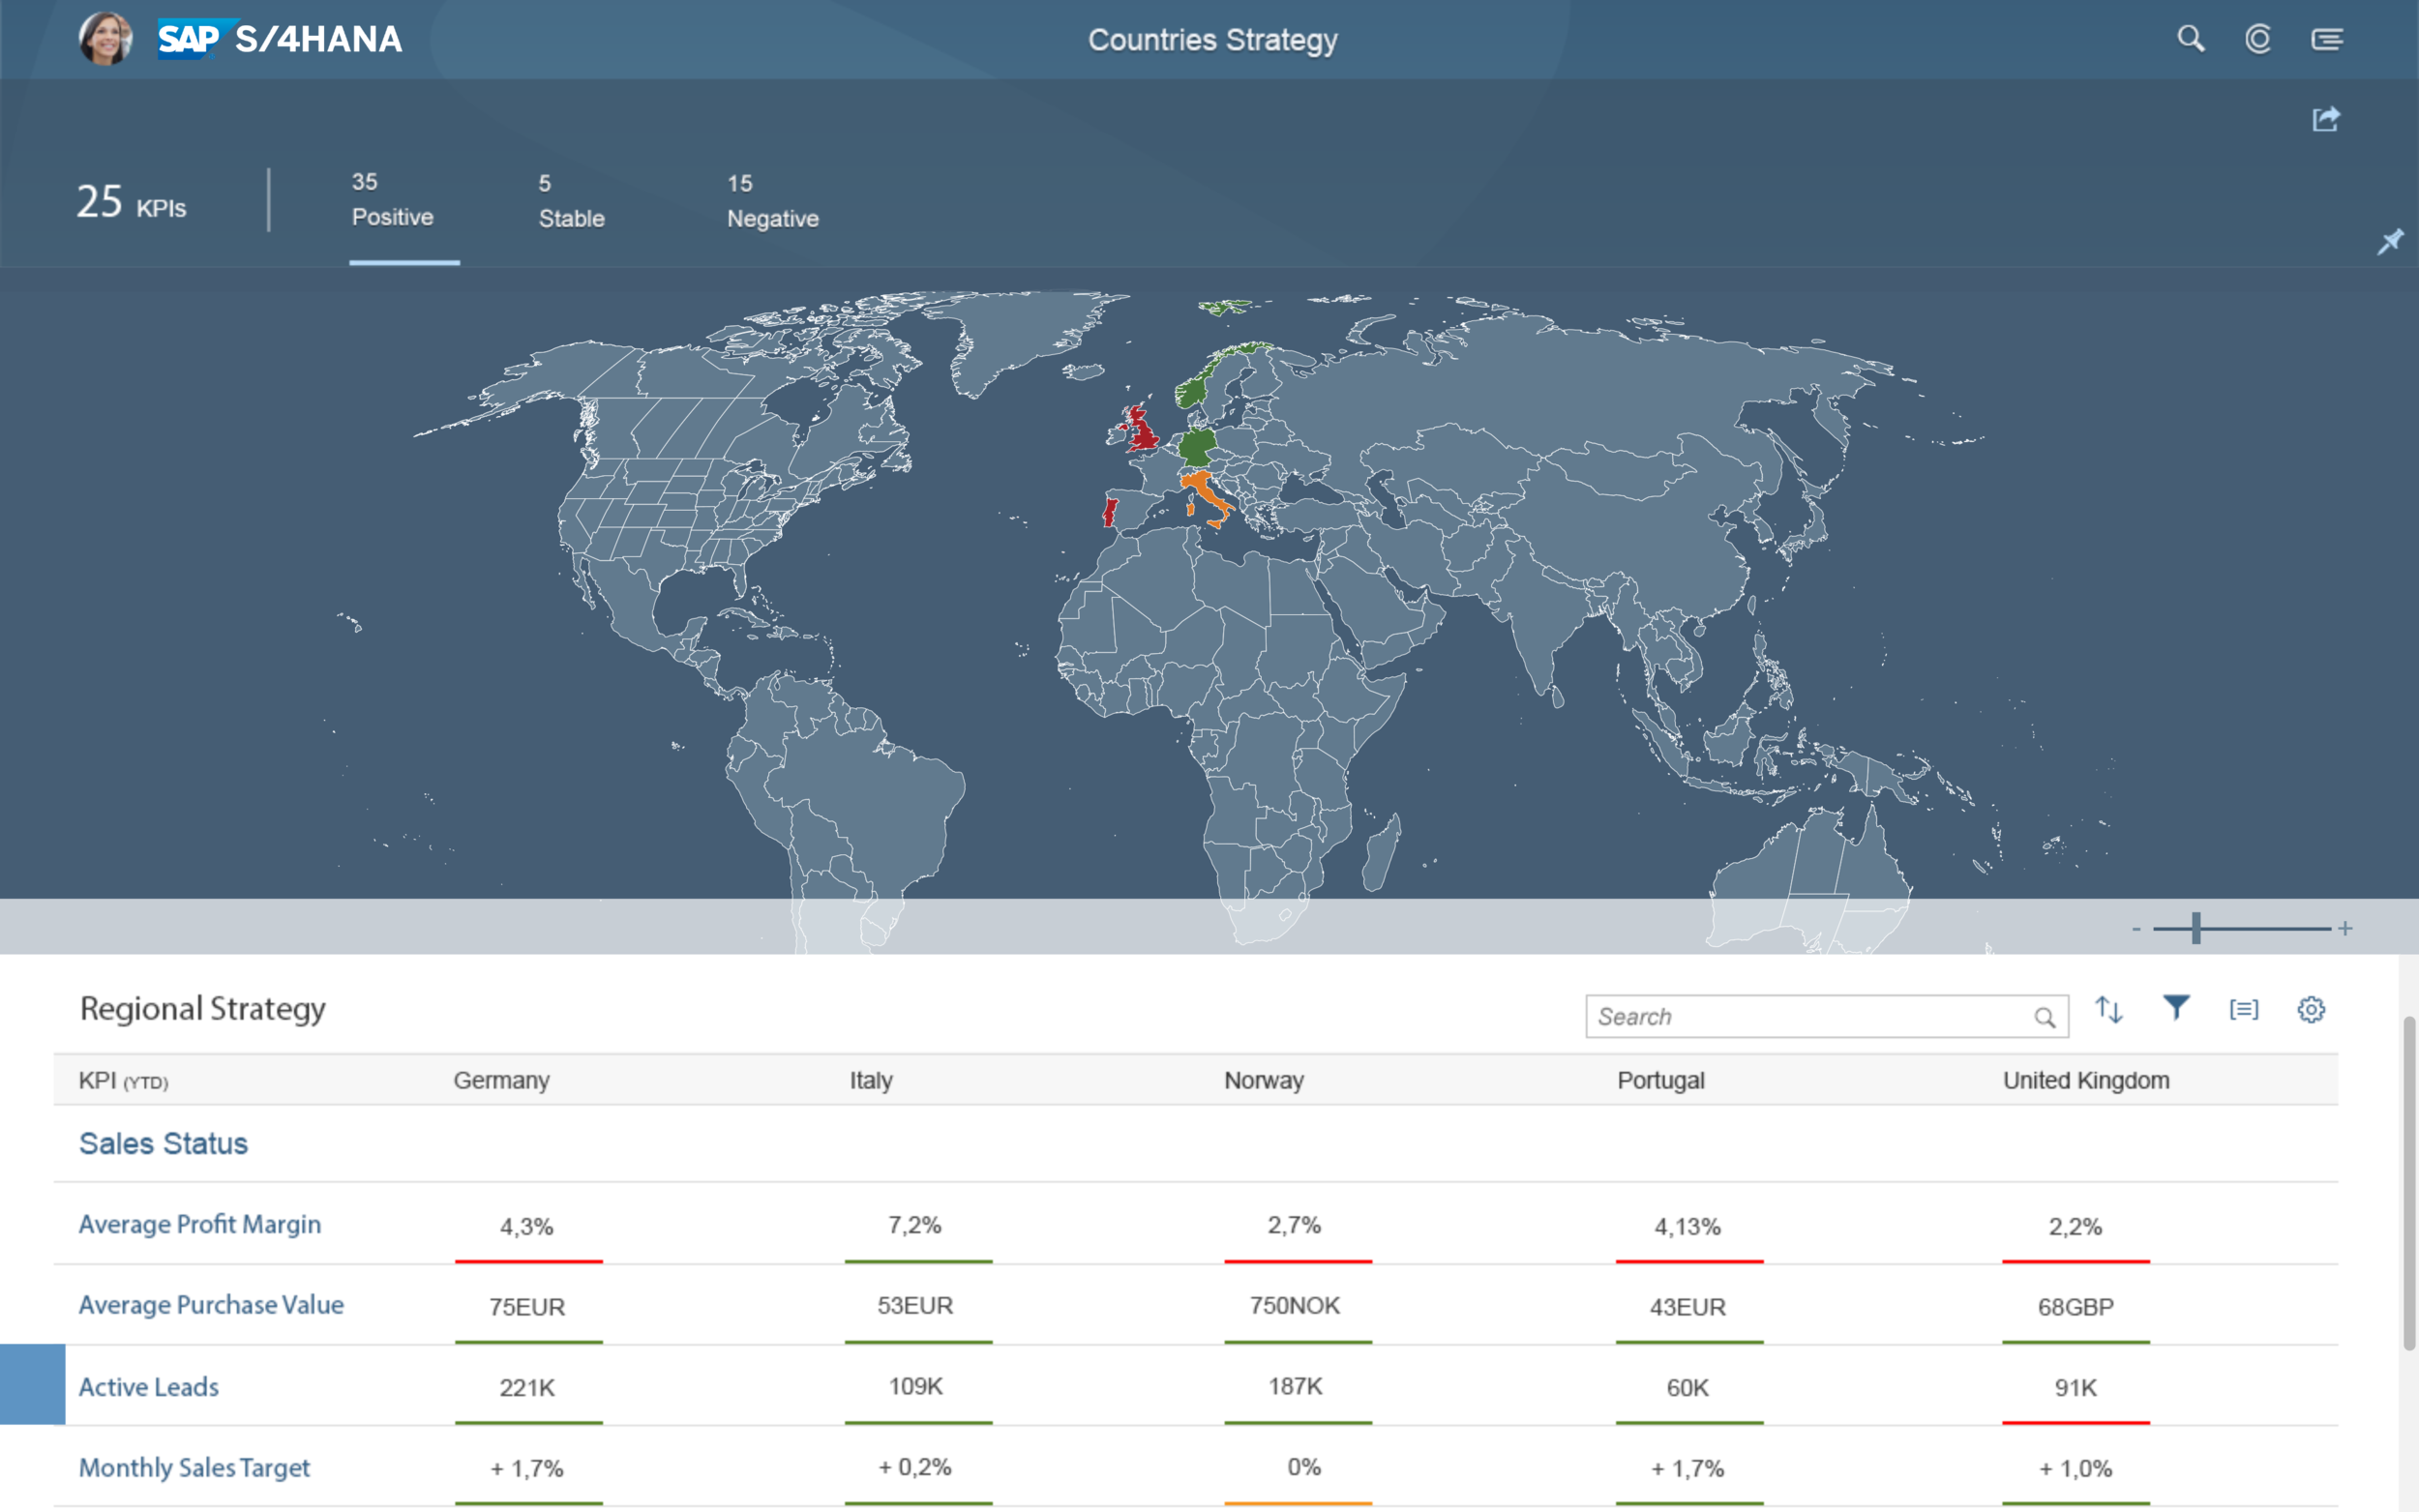
The prototype was developed in high fidelity mainly to be pitched to internal stakeholders and perform initial feedback with external and internal experts.
The impact of the UX Research was the deprioritization of the project due to competing internal solutions and medium to low value perceived by external and internal experts. That also meant savings on resources in our development teams and the opportunity to invest in a new topic, that proved to be more relevant to both SAP strategy and our customers.